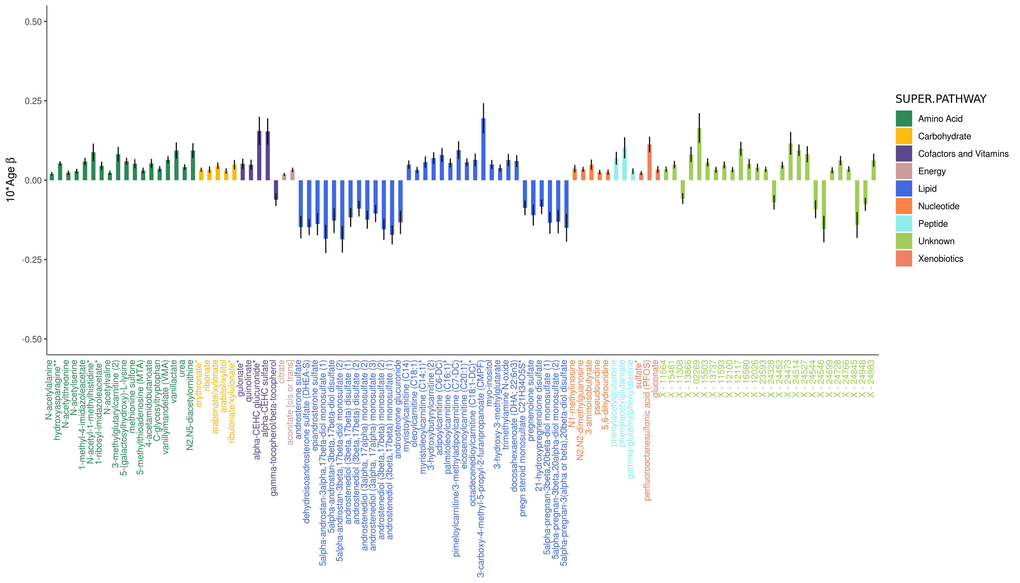
Figure 1.Adjusted effects of a 10-year increase in age on the top 100 metabolites most strongly influenced by age. Positive values indicate the amount a metabolite increased over 10 years, whereas negative values indicate the amount a metabolite decreased over 10 years. Black vertical lines indicate standard errors.