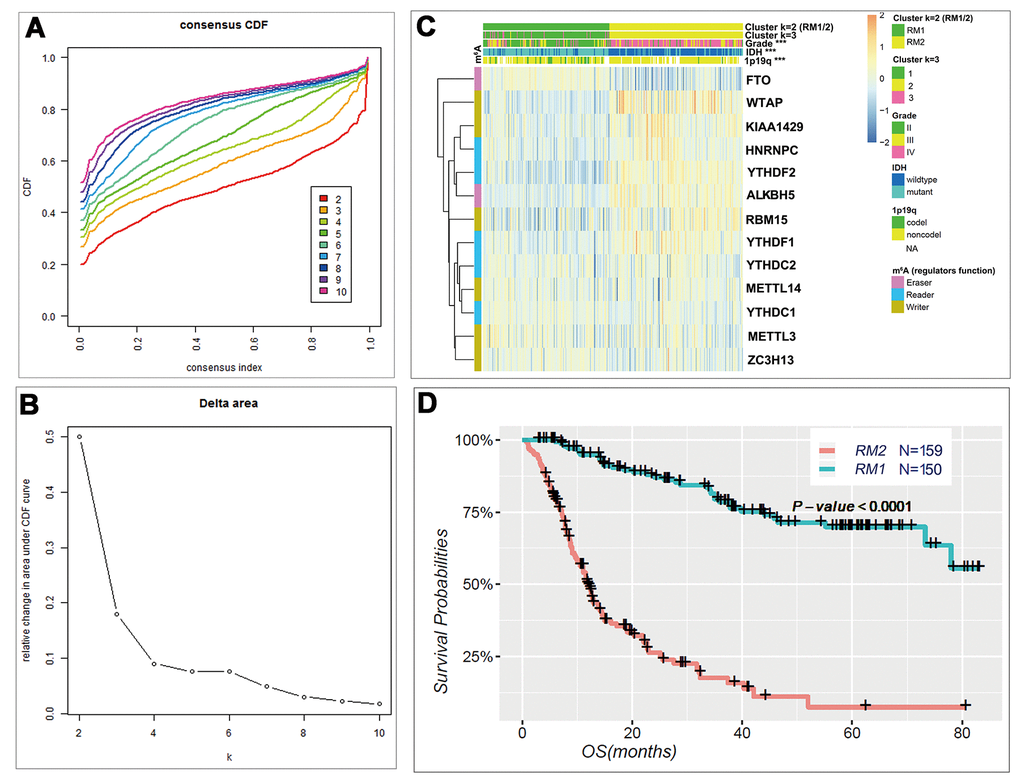
Figure 2.Differential clinicopathological features and overall survival of gliomas in the RM1/2 subgroups. (A) Consensus clustering cumulative distribution function (CDF) for k = 2 to 10. (B) Relative change in area under CDF curve for k = 2 to 10. (C) Heatmap and clinicopathologic features of the two clusters (RM1/2) defined by the m6A RNA methylation regulators consensus expression. (D) Kaplan–Meier overall survival (OS) curves for 309 CGGA glioma patients.