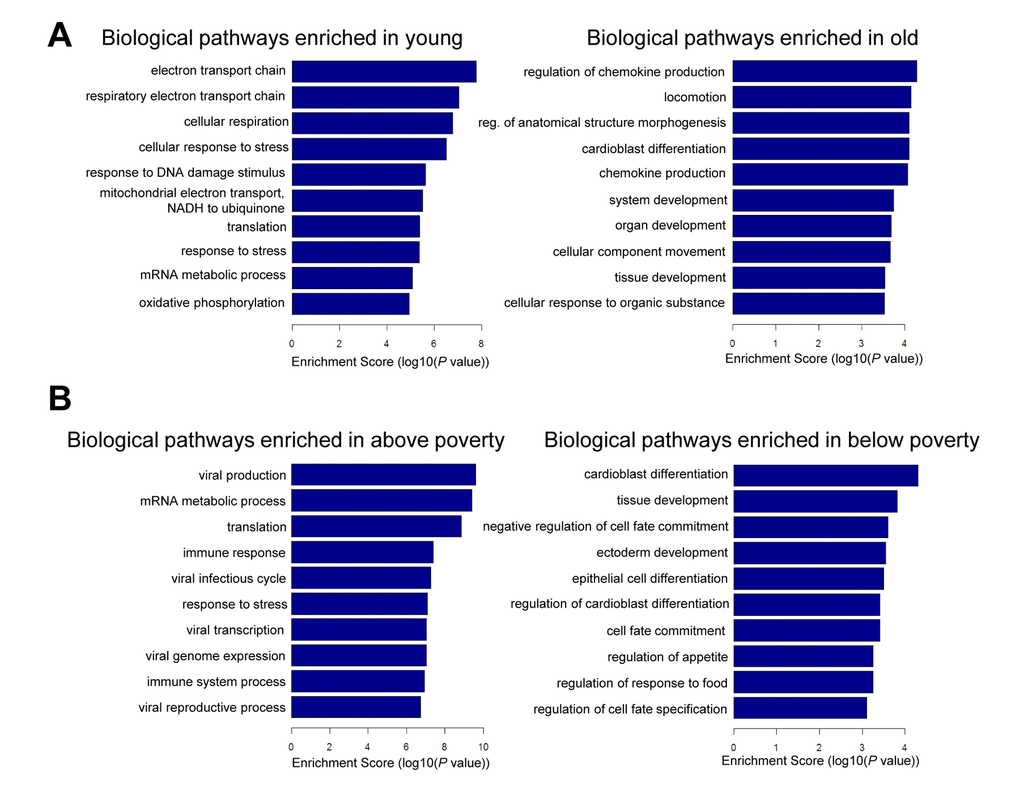
Figure 5.Pathway analysis for age and poverty. Differentially expressed mRNAs with age and poverty were used for gene ontology (GO) analysis using categories derived from Gene Ontology. Top biological pathways are shown for age (A) and poverty (B).
Figure 5 — Age and poverty status alter the coding and noncoding transcriptome | Aging