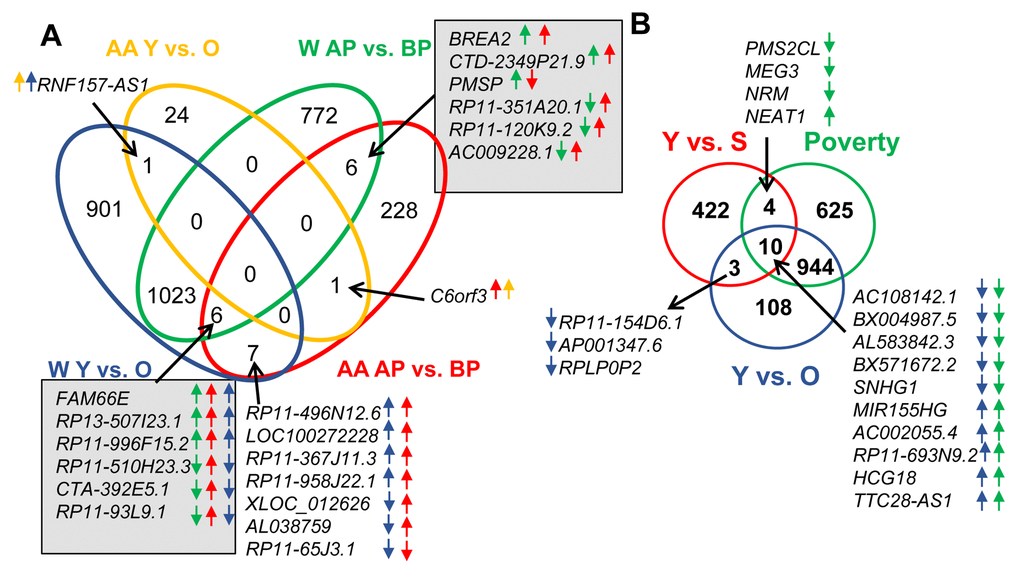
Figure 2.Comparison of lncRNA level changes with age, poverty and senescence. (A) Significantly changed lncRNA abundance was compared between African American (AA) males living below poverty (BP) and above poverty (AB) to white males (W) living below and above poverty. (B) Changes in lncRNAs levels in whites with poverty and age were also compared to significantly changed senescence-associated lncRNAs (SAL-RNAs) identified previously [31]. The comparisons in (A) were done using the Seqname and (B) using Gene symbol, hence the slight differences in numbers. Arrows indicate the direction of change (higher or lower) in the comparisons. The color of the arrow indicates the comparison examined.