Submit an Article
Navigate
Home
Editorial Board
Editorial Policies
Current Volume
Archive
Scientific Integrity
Publication Ethics Statements
Interviews with Outstanding Authors
Newsroom
Sponsored Conferences
Podcast
Contact
Special Collections
Submit an Article
Online ISSN: 1945-4589
Research Paper
|
Volume 11, Issue 3
|
pp. 1019–1029
A comprehensive evaluation of 181 reported
CHST6
variants in patients with macular corneal dystrophy
Back to article
Figure 4
(4 of 4)
−
100%
+
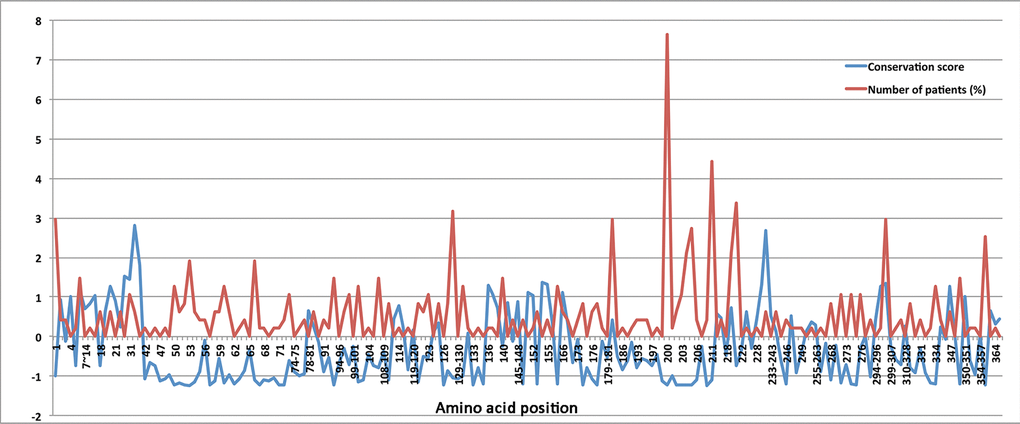
Figure 4.
The normalized conservation scores (blue curve) for each residue in CHST6 protein and the percentage of reported MCD patients who carried mutations in the corresponding position (red curve)