Submit an Article
Navigate
Home
Editorial Board
Editorial Policies
Current Volume
Archive
Scientific Integrity
Publication Ethics Statements
Interviews with Outstanding Authors
Newsroom
Sponsored Conferences
Podcast
Contact
Special Collections
Submit an Article
Online ISSN: 1945-4589
Research Paper
|
Volume 11, Issue 3
|
pp. 1008–1018
Urinary metabolite signature in bipolar disorder patients during depressive episode
Back to article
Figure 1
(1 of 7)
−
100%
+
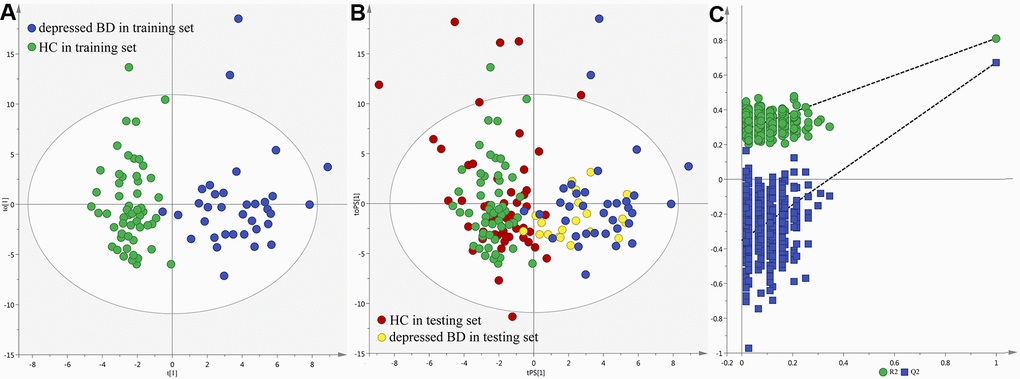
Figure 1.
Metabolomic analysis of urine samples from the recruited subjects.
(
A
) OPLS-DA model; (
B
) T-predicted scatter plot; (
C
) 300-iteration permutation test.
Figure 1 — Urinary metabolite signature in bipolar disorder patients during depressive episode | Aging