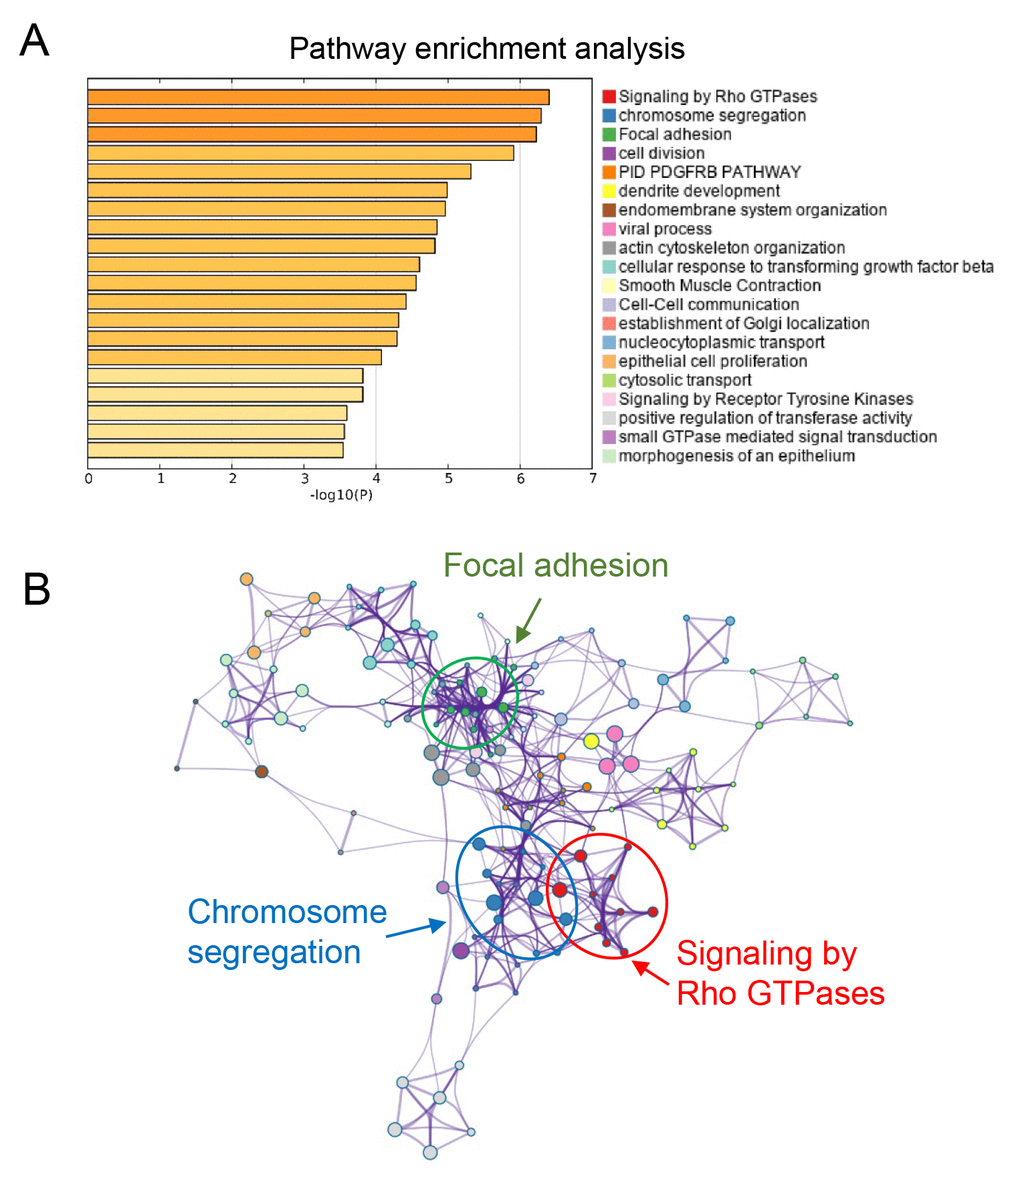
Figure 7.Functional prediction of three-gene model. (A) Significantly enriched pathways of the three genes and their co-expressed genes. (B) The functional enrichment map of pathways. Each node represents a GO term. Node size represents the number of gene in the pathways.