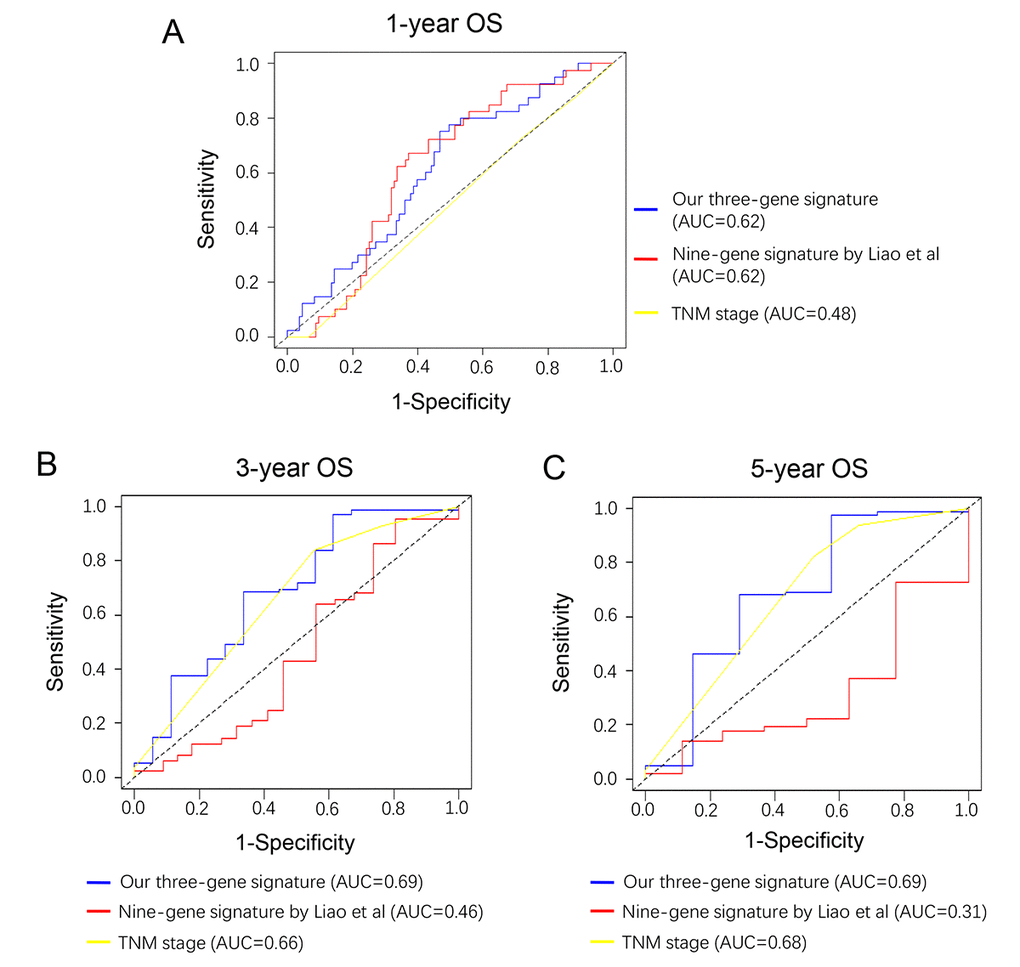
Figure 6.Comparison of our three-gene model and other literature models. Time-dependent ROC analysis was performed to compare the three models in predicting 1-year (A), 3-year (B) and 5-year (C) OS.
Figure 6 — Three hypomethylated genes were associated with poor overall survival in pancreatic cancer patients | Aging