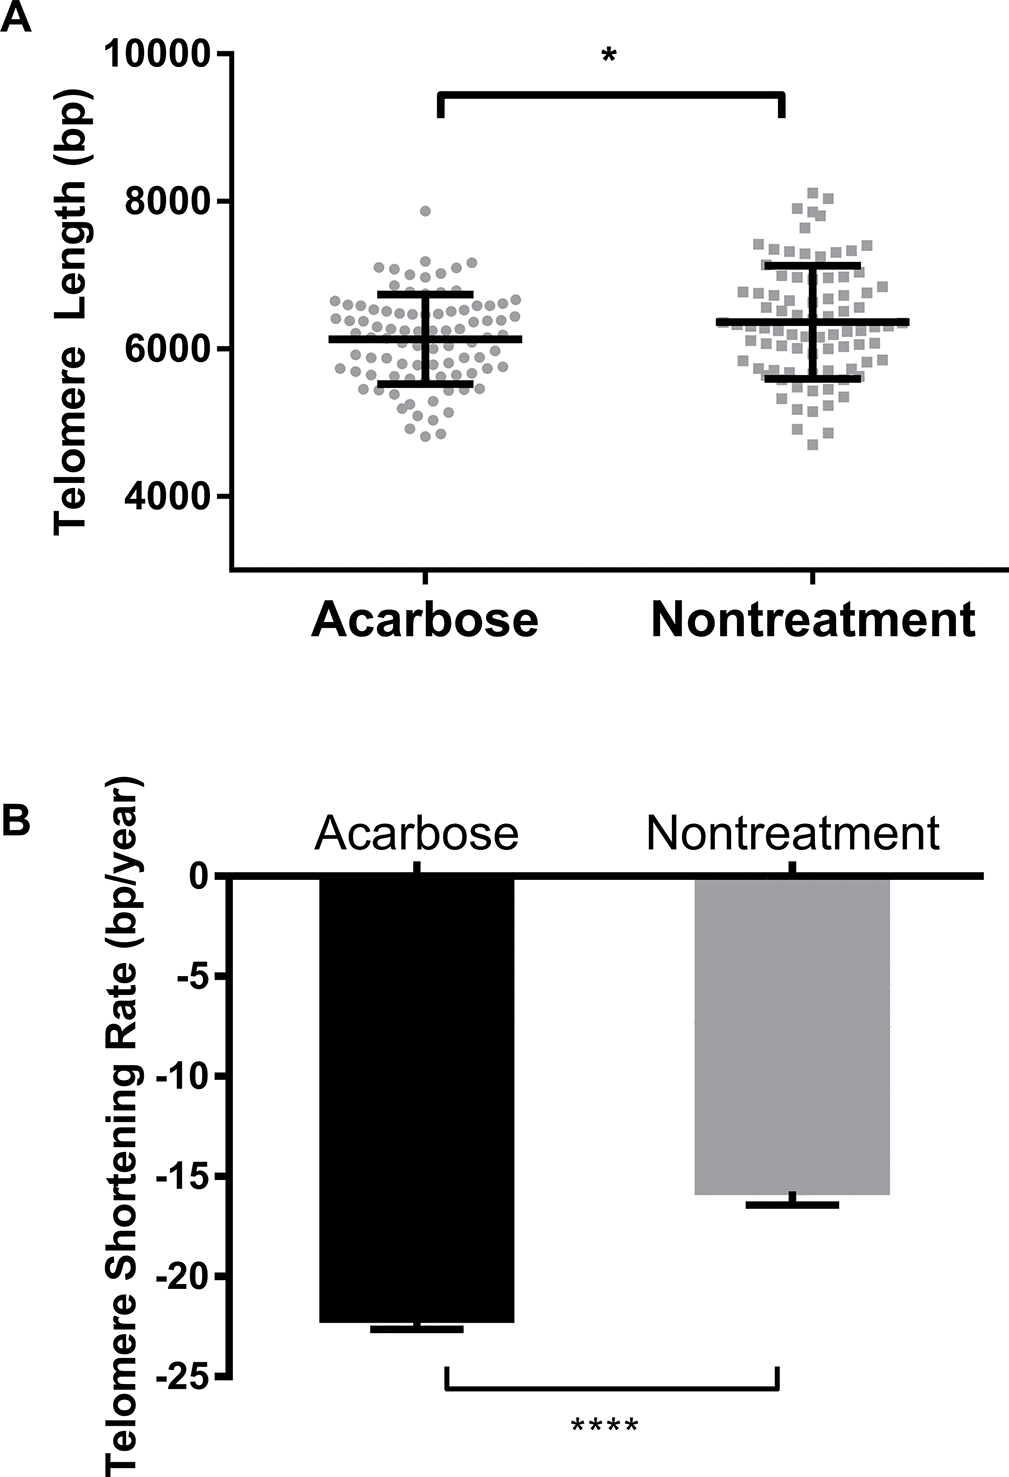
Figure 3.Comparison of telomere length and TSR between acarbose-treated and nontreated T2DM patients. Comparison of telomere length (A) and TSR (B) between the acarbose group and the nontreatment group. Telomere length is presented as the mean ± SD. TSRs are presented as the mean ± SEM. *indicates P < 0.05 and ****indicates P < 0.0001.