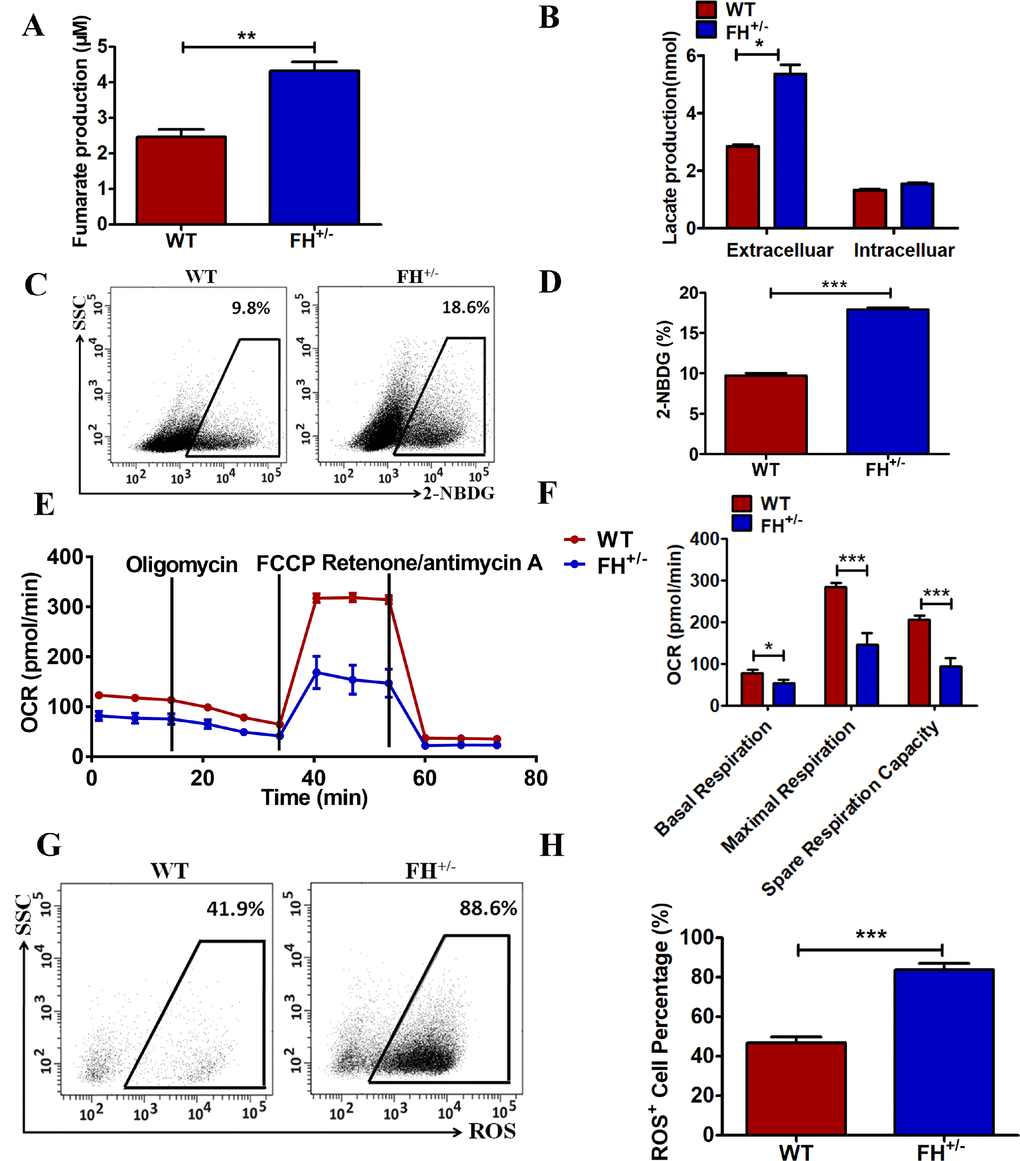
Figure 4.Metabolic reprogramming of the FH+/– cells(A) Significantly more cellular fumarate production, and the bar graphs represent the fumarate concentration detected with the assay kit. (B) Extracellular lactate excretion and cytoplasmic lactate production. (C) Representative glucose consumption results examined by flow cytometry, and the corresponding histogram is shown in (D). (E) Representative OCR results investigated by a Seahorse XFe96 Extracellular Flux Analyser and (F) the OCR histograms. A representative flow cytometry of ROS is shown in (G), and the corresponding histogram is shown in (H), where the bar graphs show the percentages of ROS+ cells among the WT and FH+/– cells.