Submit an Article
Navigate
Home
Editorial Board
Editorial Policies
Current Volume
Archive
Scientific Integrity
Publication Ethics Statements
Interviews with Outstanding Authors
Newsroom
Sponsored Conferences
Podcast
Contact
Special Collections
Submit an Article
Online ISSN: 1945-4589
Research Paper
|
Volume 11, Issue 2
|
pp. 480–500
Development of a prognostic index based on an immunogenomic landscape analysis of papillary thyroid cancer
Back to article
Figure 5
(5 of 11)
−
100%
+
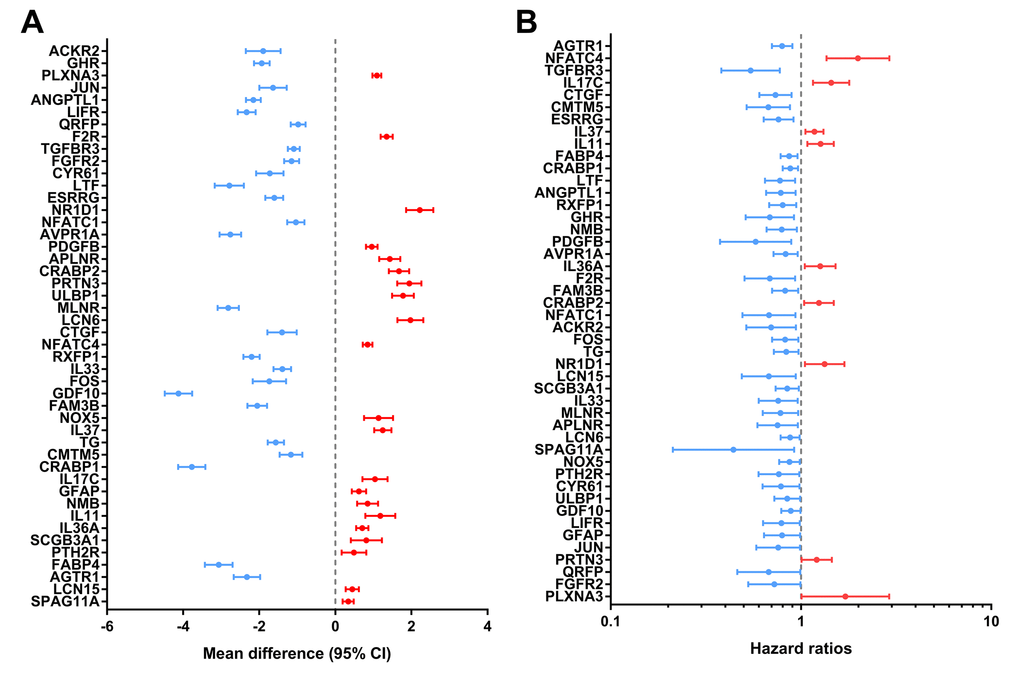
Figure 5.
Expression profiles and prognostic values of hub immune-related genes.
(
A
) Forest plot of mean difference showing gene differences between PTC and non-tumor samples. (
B
) Forest plot of hazard ratios showing the prognostic values of genes.