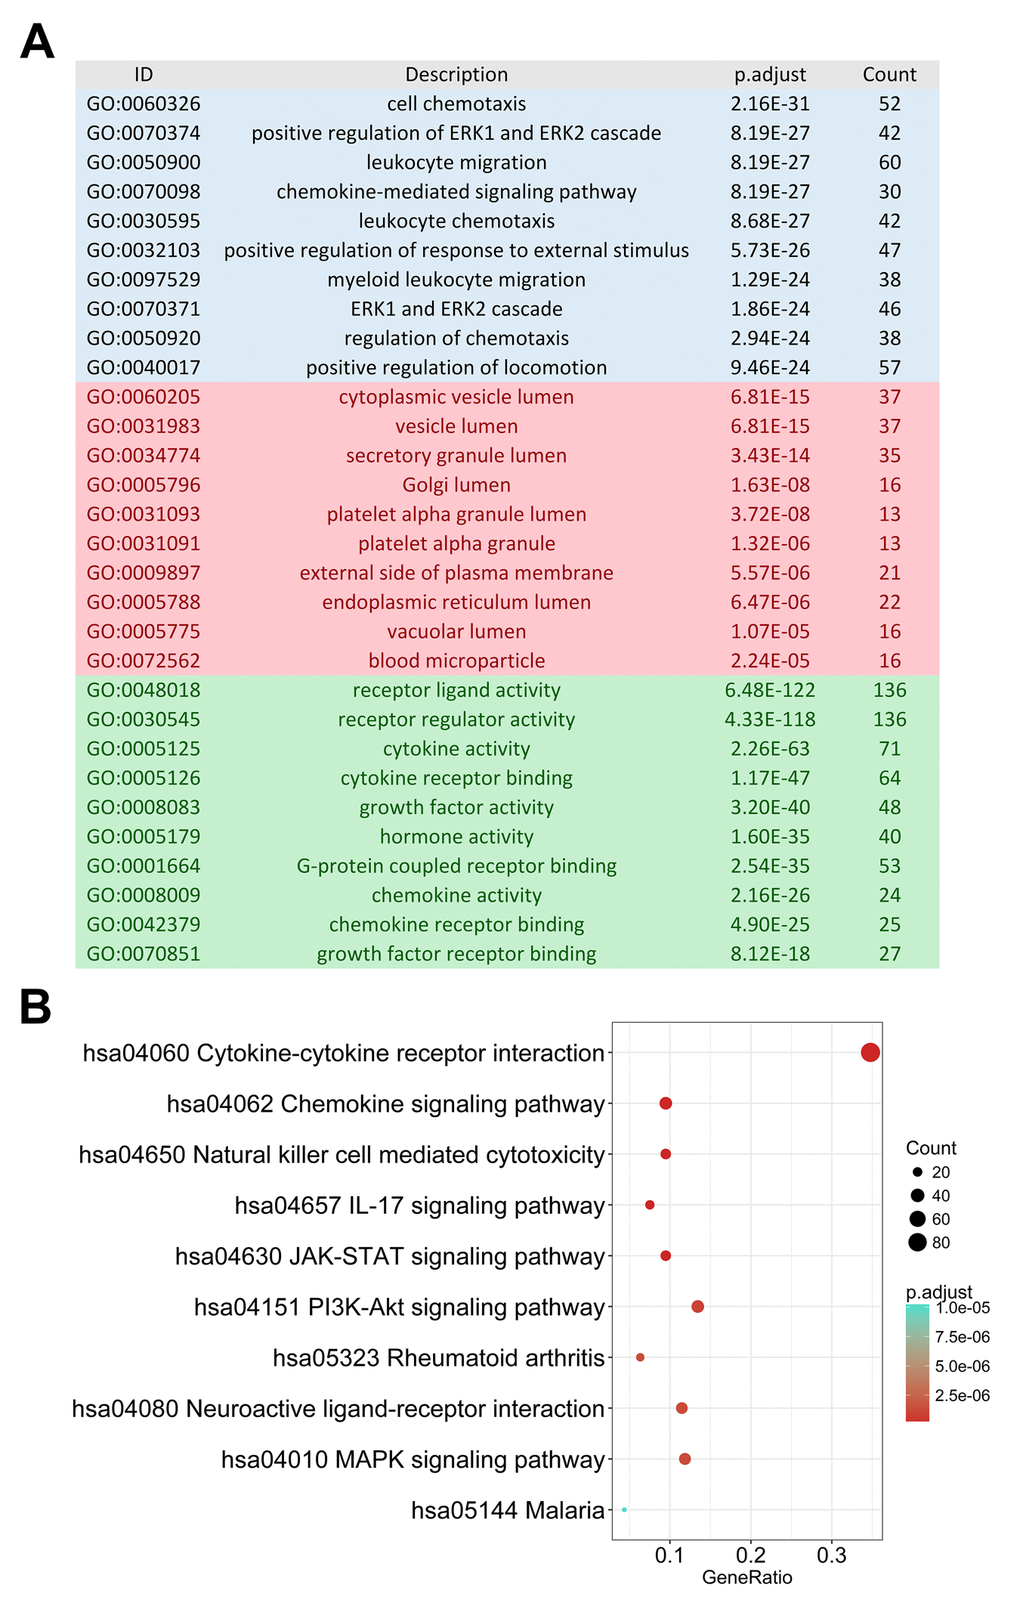
Figure 2.Gene functional enrichment of differentially expressed immune-related genes. (A) Gene ontology analysis; blue, red and green bars represent biological process, cellular component and molecular function, respectively. (B) The top 10 most significant Kyoto Encyclopedia of Genes and Genomes pathways.