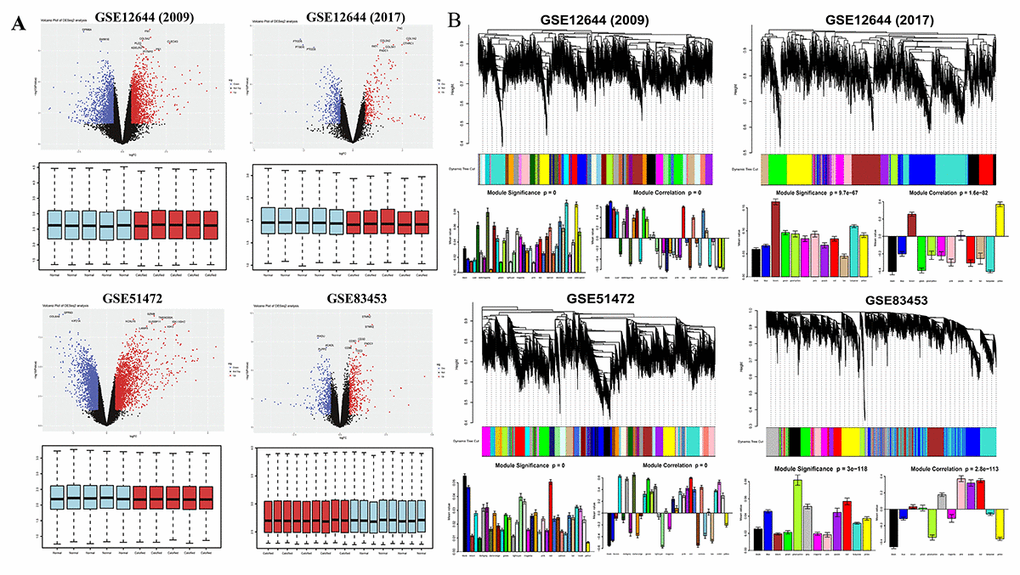
Figure 1.Overview of DEGs between calcified aortic valve stenosis and normal aortic valve tissues. (A) Volcano plot of DEGs and boxplot of normalized gene expression profiles. In the volcano plots, each color dot represents a downregulated or upregulated gene; The red color indicated high expressed genes and the blue color indicated low expressed genes, above and below the median, respectively. (B) Gene modules’ dendrogram plots of DEGs, and bar plots of eigengenes’ module significance and correlation. In the dendrogram plots, each leaf (short vertical lines) in the dendrogram corresponds to a gene and the branches are expression modules of highly interconnected groups of genes with a color to indicate its module assignment.