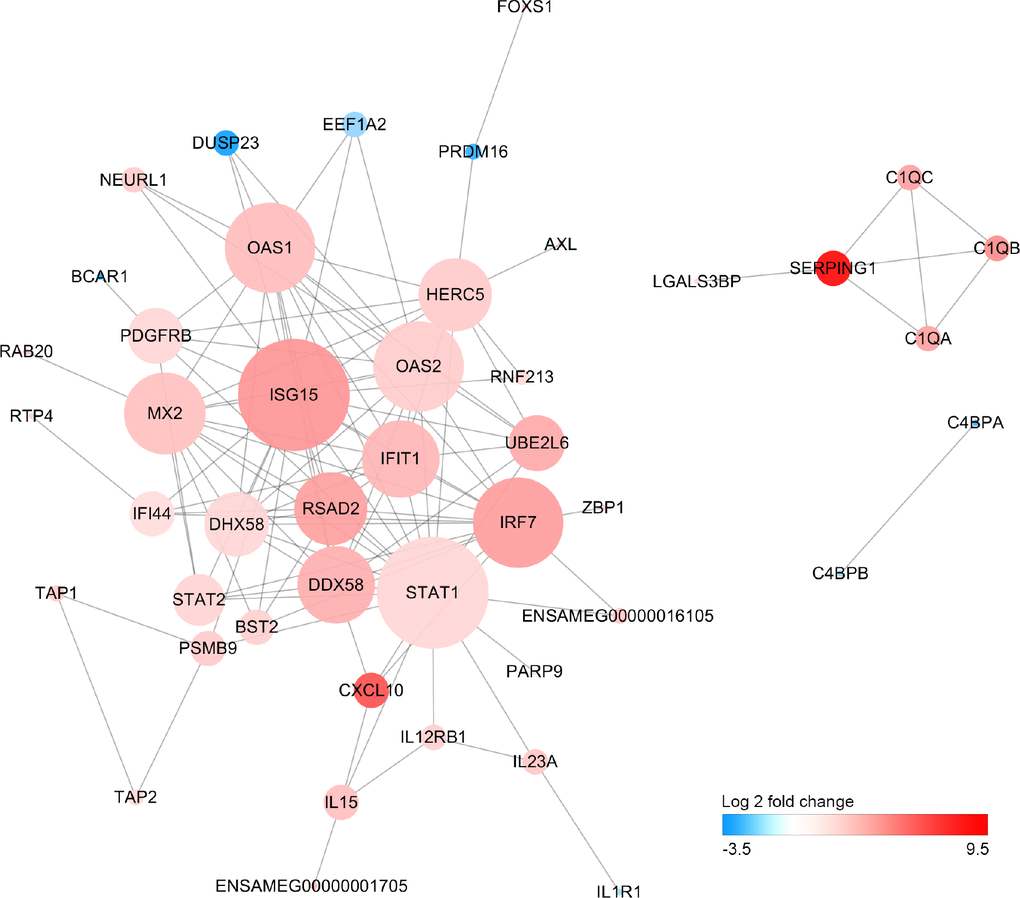
Figure 5.Protein-protein interaction network of differentially expressed genesSize of the node is proportional to the number of DEGs interacted with it, and color of node represents Log2FoldChange in expression levels of DEGs between old and young giant pandas.