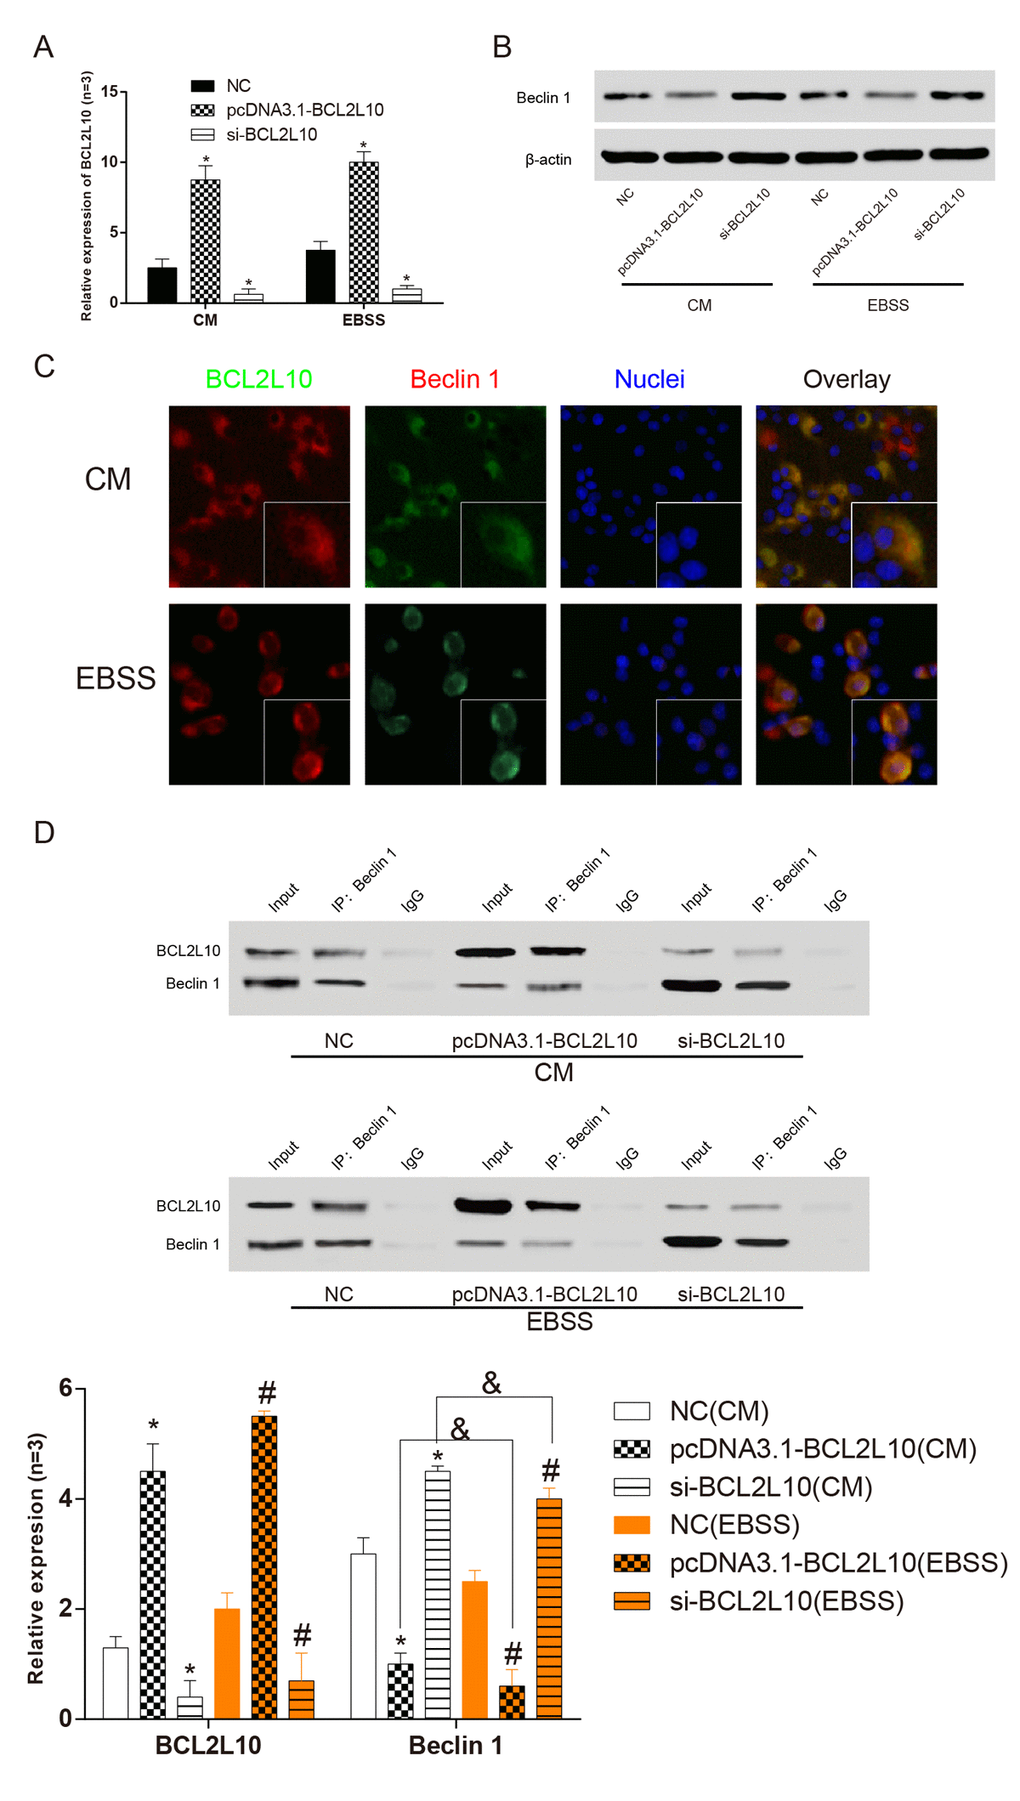
Figure 5.BCL2L10 and BECN1 bound to each other in in Hep3Bcells. (A) qRT-PCR was used to detect the expression level of BCL2L10 after transfection. (B) The expression level of Beclin 1 was detected by western blot. (C) The locations of BCL2L10 and Beclin 1 in both complete medium and starved medium were observed by immunofluorescence. (D) The expression level of Beclin 1 in BCL2L10 was detected by immunoprecipitation assay. CM: complete medium; EBSS: starvation medium. * means to compare with NC (CM) group P<0.05; # means to compare with NC (EBSS) group; & means EBSS groups compared with CM groups P<0.05.