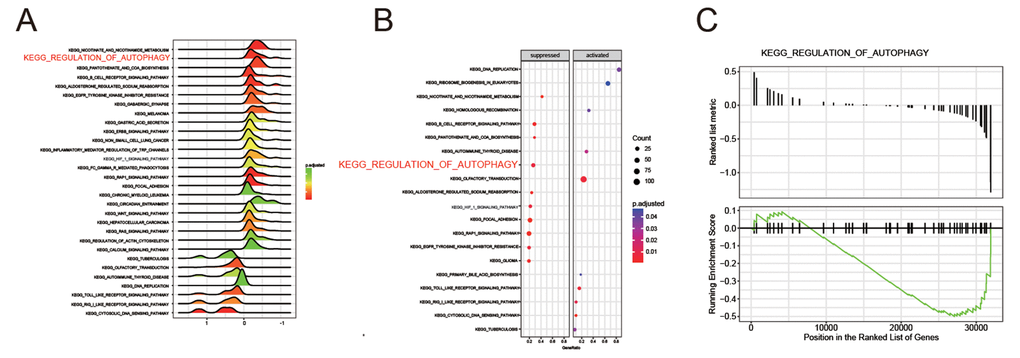
Figure 2.The regulation of autophagy pathway was suppressed in HCC. (A-B) Joyplot and dotplot suggested the distributions of some KEGG pathways gene sets in all differential genes. (C-D) Gseaplot showed the regulation of autophagy pathway was discovered in the region where genes were down-expressed in HCC.