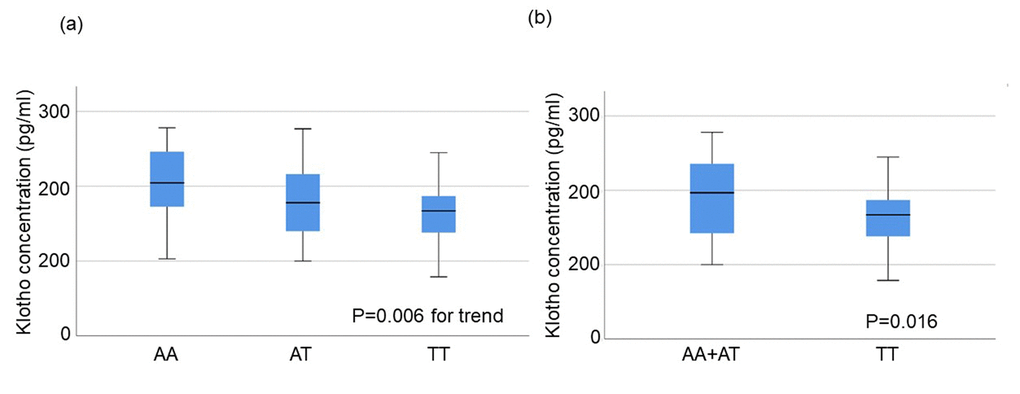
Figure 2.Plasma klotho concentration in subjects aged 70±1 years stratified by rs650439. (a) Comparison among three groups (AA, AT, TT). The significance of trend in klotho concentration among the groups was determined by Jonckheere-Terpstra trend test. (b) Comparison between two groups (AA+AT vs. TT). The significance of difference between two groups was determined by Mann-Whitney U test.