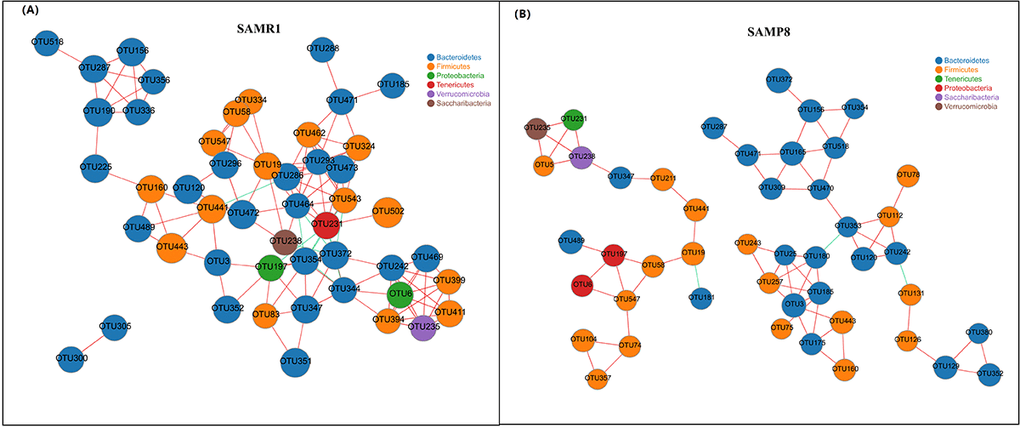
Figure 5.Correlation network analysis of the 50 most abundant OTUs for (A) SAMR1 and (B) SAMP8. Networks show significant positive (red) and negative (green) pairwise correlations between operational taxonomic units (OTUs). OTUs are colored by phylum affiliation and sized by mean relative abundance.