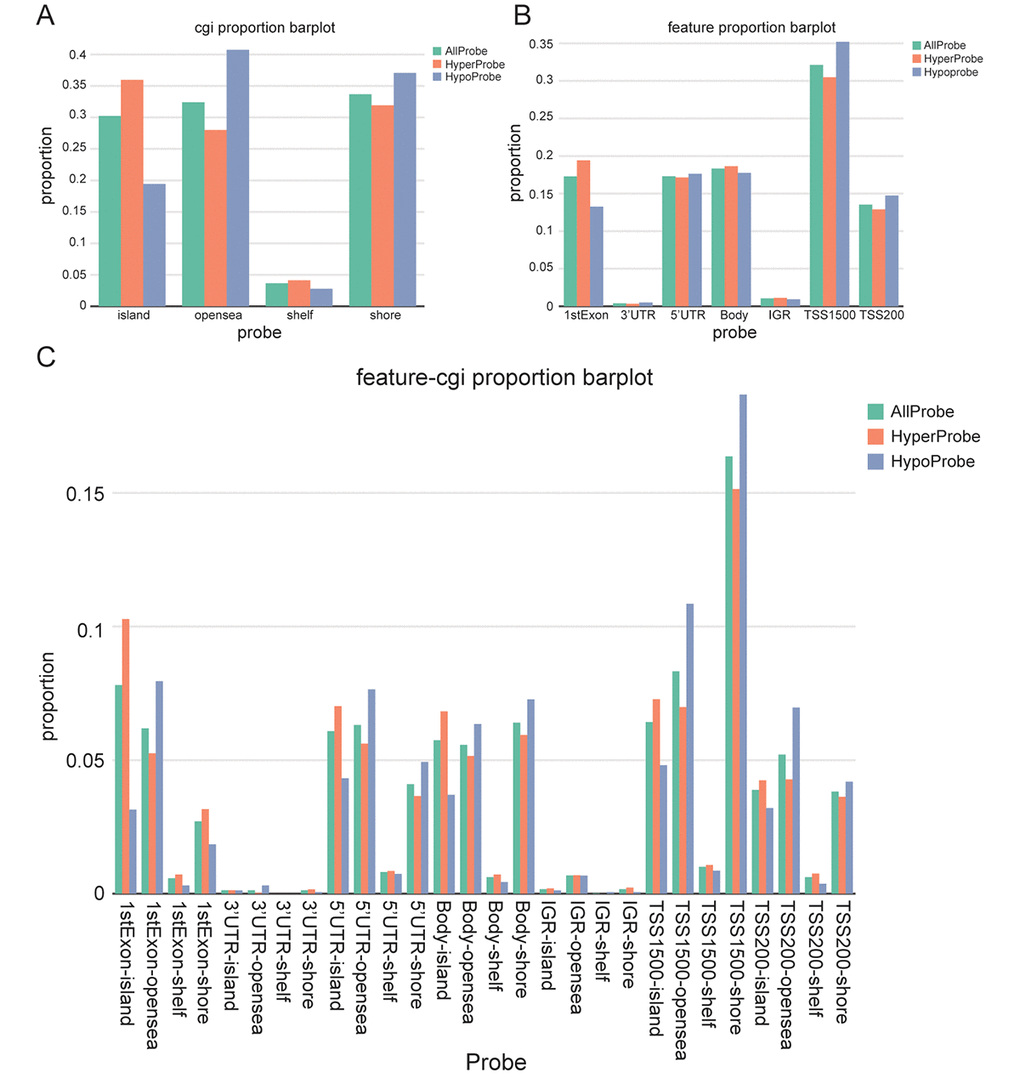
Figure 2.Screening and visualization of differential CpG sites. (A) Distribution of differentially methylated CpG sites according to regions (shores, shelves, islands, and open sea). (B) Distribution of differentially methylated CpG sites according to gene position (1stExon, 3’ UTRs or 5’ UTRs, body, IGR, TSS1500 and TSS200). (C) The distribution of differentially methylated CpG sites by combining CpG regions and gene location.