Submit an Article
Navigate
Home
Editorial Board
Editorial Policies
Current Volume
Archive
Scientific Integrity
Publication Ethics Statements
Interviews with Outstanding Authors
Newsroom
Sponsored Conferences
Podcast
Contact
Special Collections
Submit an Article
Online ISSN: 1945-4589
Research Paper
|
Volume 10, Issue 11
|
pp. 3283–3293
Uncoupling protein 4 (
UCP4
) gene variability in neurodegenerative disorders: further evidence of association in Frontotemporal dementia
Back to article
Figure 1
−
100%
+
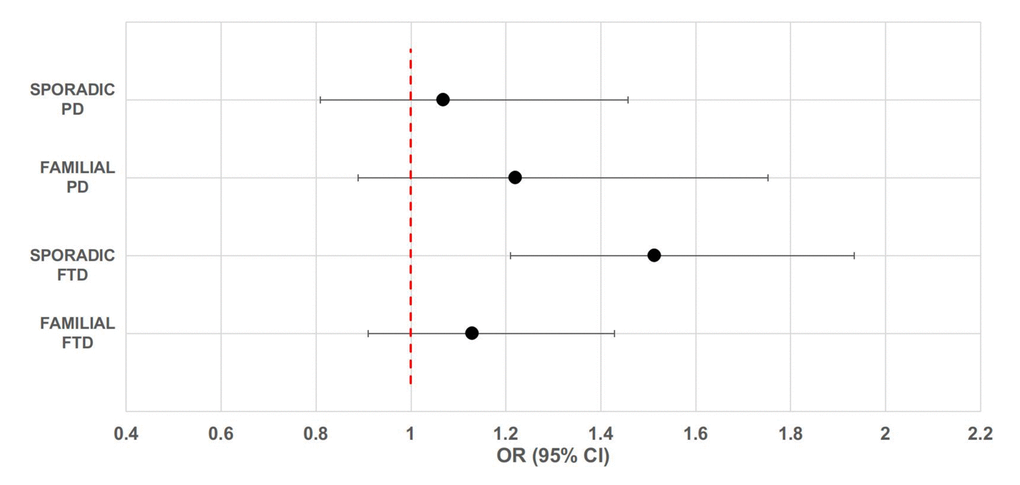
Figure 1.
Forest plot of overall analysis for the association between rs9472817 in UCP4 and risk of familial and sporadic FTD and PD.
The circle and horizontal lines represent odds ratio (OR) and 95% confidence interval (CI).