Submit an Article
Navigate
Home
Editorial Board
Editorial Policies
Current Volume
Archive
Scientific Integrity
Publication Ethics Statements
Interviews with Outstanding Authors
Newsroom
Sponsored Conferences
Podcast
Contact
Special Collections
Submit an Article
Online ISSN: 1945-4589
Research Paper
|
Volume 10, Issue 11
|
pp. 3185–3209
Identification of an energy metabolism-related signature associated with clinical prognosis in diffuse glioma
Back to article
Figure 6
(6 of 6)
−
100%
+
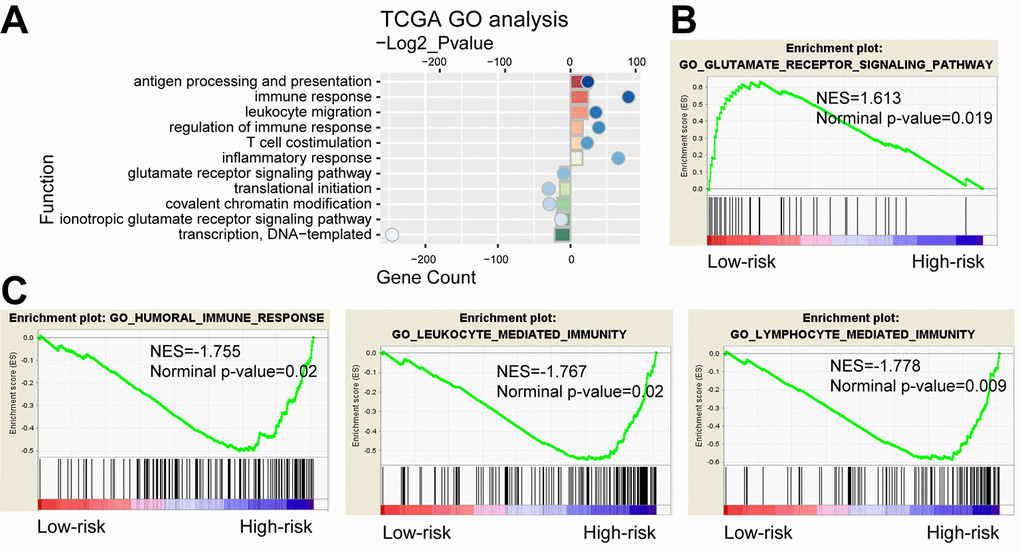
Figure 6.
Functional analysis of the 29-gene signature.
(
A
) GO annotations based on the top 2000 genes positively and negatively associated with the 29-gene signature. (
B-C
) GSEA analysis based on the median value of risk score.