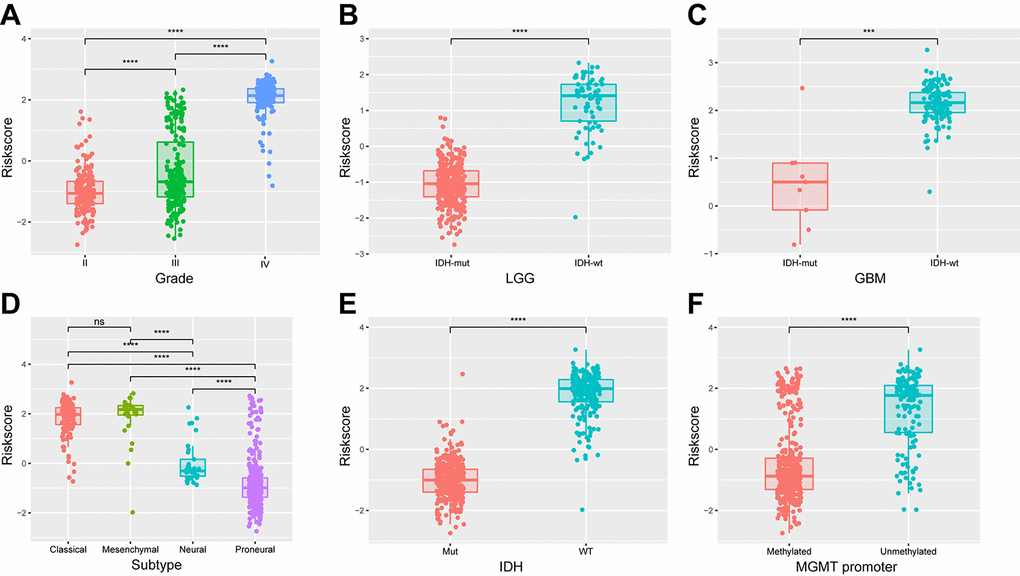
Figure 5.Association between the energy metabolism-related signature and pathologic features in TCGA cohort. (A-F) Distribution of the risk score in stratified patients by grade, subtype, IDH and MGMT promoter status.
Figure 5 — Identification of an energy metabolism-related signature associated with clinical prognosis in diffuse glioma | Aging