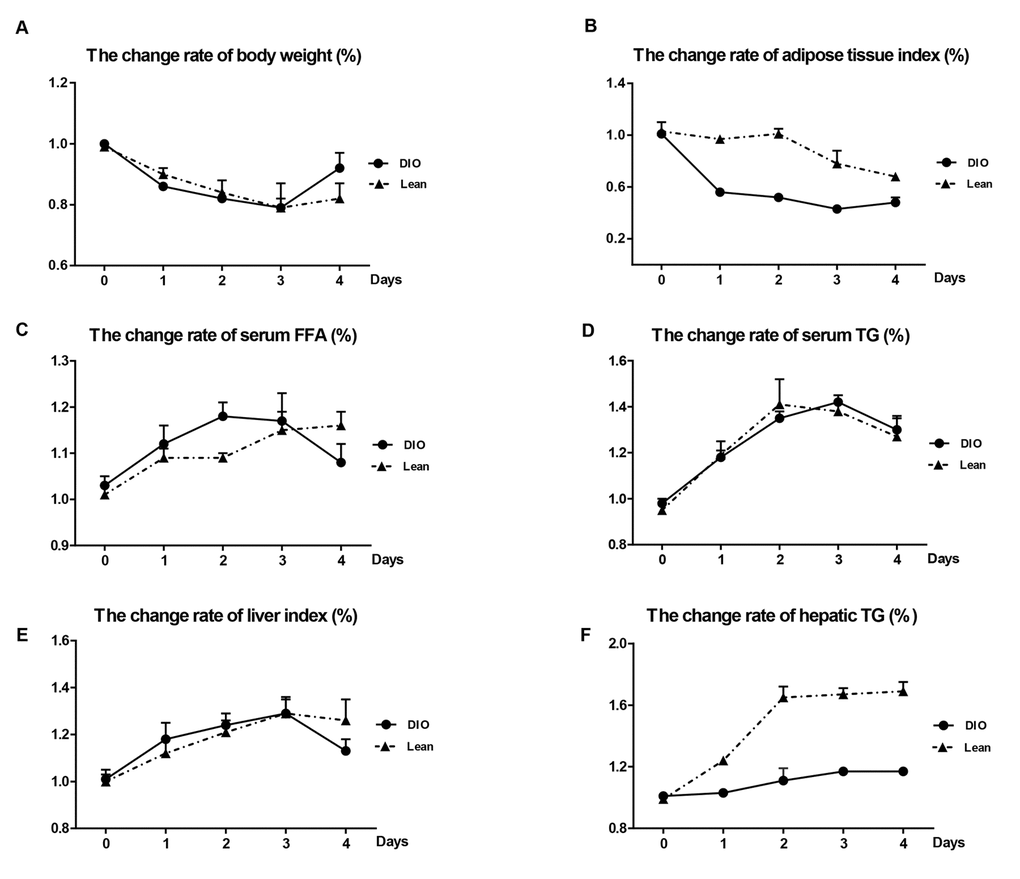
Figure 2.Effects of E. coli infection on body weight and adipose tissue lipolysis in the lean and DIO mice. (A) Body weight, (B) adipose tissue index, (C) serum FFA levels, (D) serum TG levels, (E) Liver index and (F) Hepatic TG contents. DIO indicates the ratio of DIO-infected/ DIO-uninfected, while Lean indicated the ratio of lean-infected/ lean-uninfected.