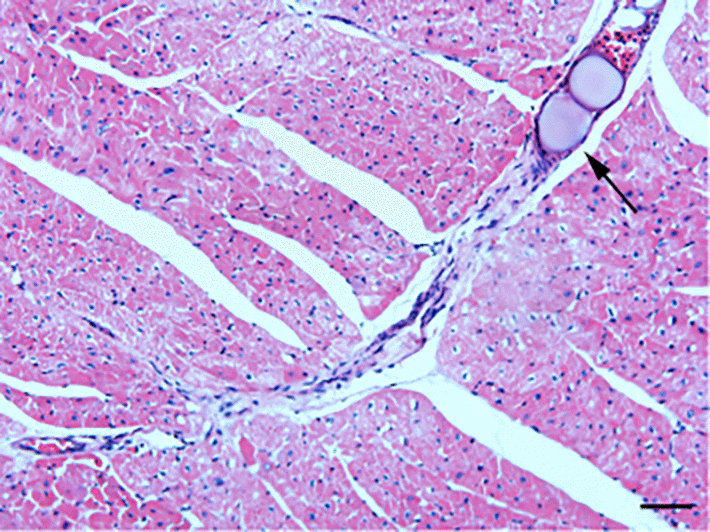
Figure 1.HE staining of microinfarct areas after CME modeling. Myocardial tissue exhibited edema and degeneration around the microspheres, accompanied by a large number of infiltrating inflammatory cells. The arrow indicates microspheres in an arteriole (x200, scale bar = 50 μm).