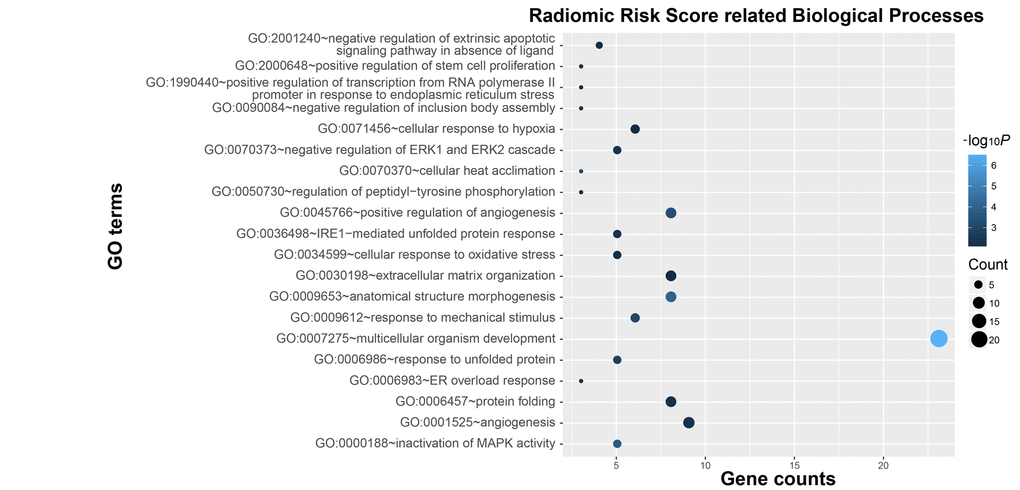
Figure 3.Functional annotation of radiomic risk score groups. Gene ontology analysis revealed a significant association among genes with increased expression in the high-risk radiomic risk score group and twenty main pathways. Column size: gene counts; point color: enrichment P value.