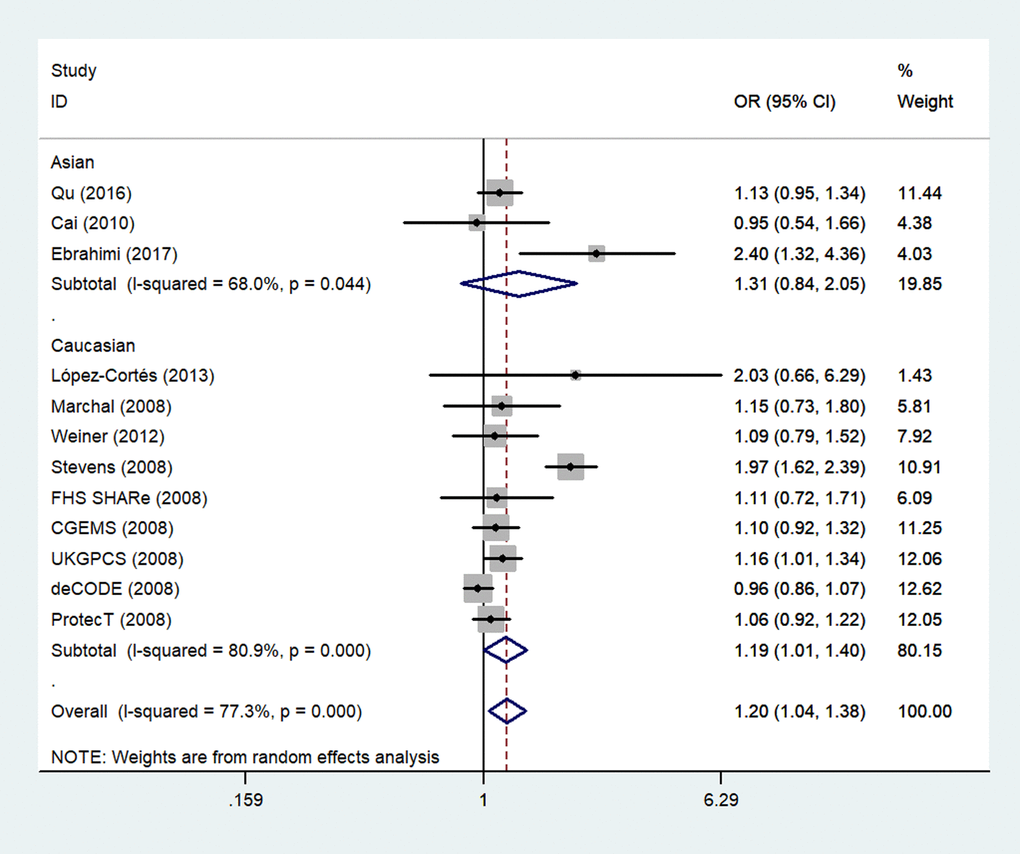
Figure 4.A forest plot of PCa risk associated with rs1805087 among whites (genotype GA vs. AA). The squares and horizontal lines correspond to the study-specific OR and 95% CI. The area of the squares reflects the weight (inverse of variance). The diamond represents the summary OR and 95% CI.