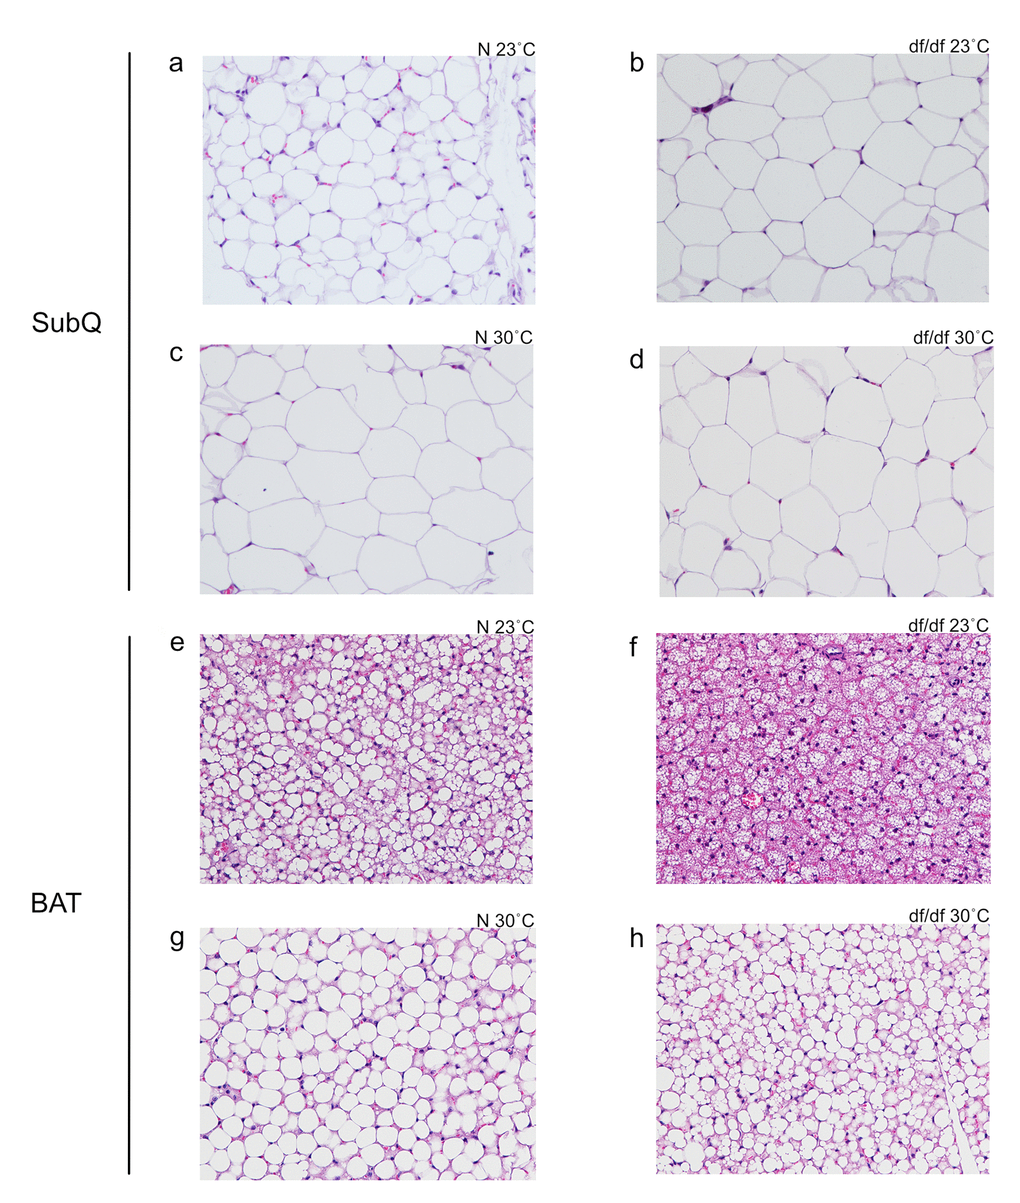
Figure 3.Increased eT resulted in increased subcutaneous white adipocyte size and altered structure of brown adipocytes. (a) Normal 23˚C subcutaneous, (b) dwarf 23˚C subcutaneous, (c) normal 30˚C subcutaneous, (d) dwarf 30˚C subcutaneous, (e) normal 23˚C brown adipose tissue, (f) dwarf 23˚C brown adipose tissue, (g) normal 30˚C brown adipose tissue, (h) dwarf 30˚C brown adipose tissue.