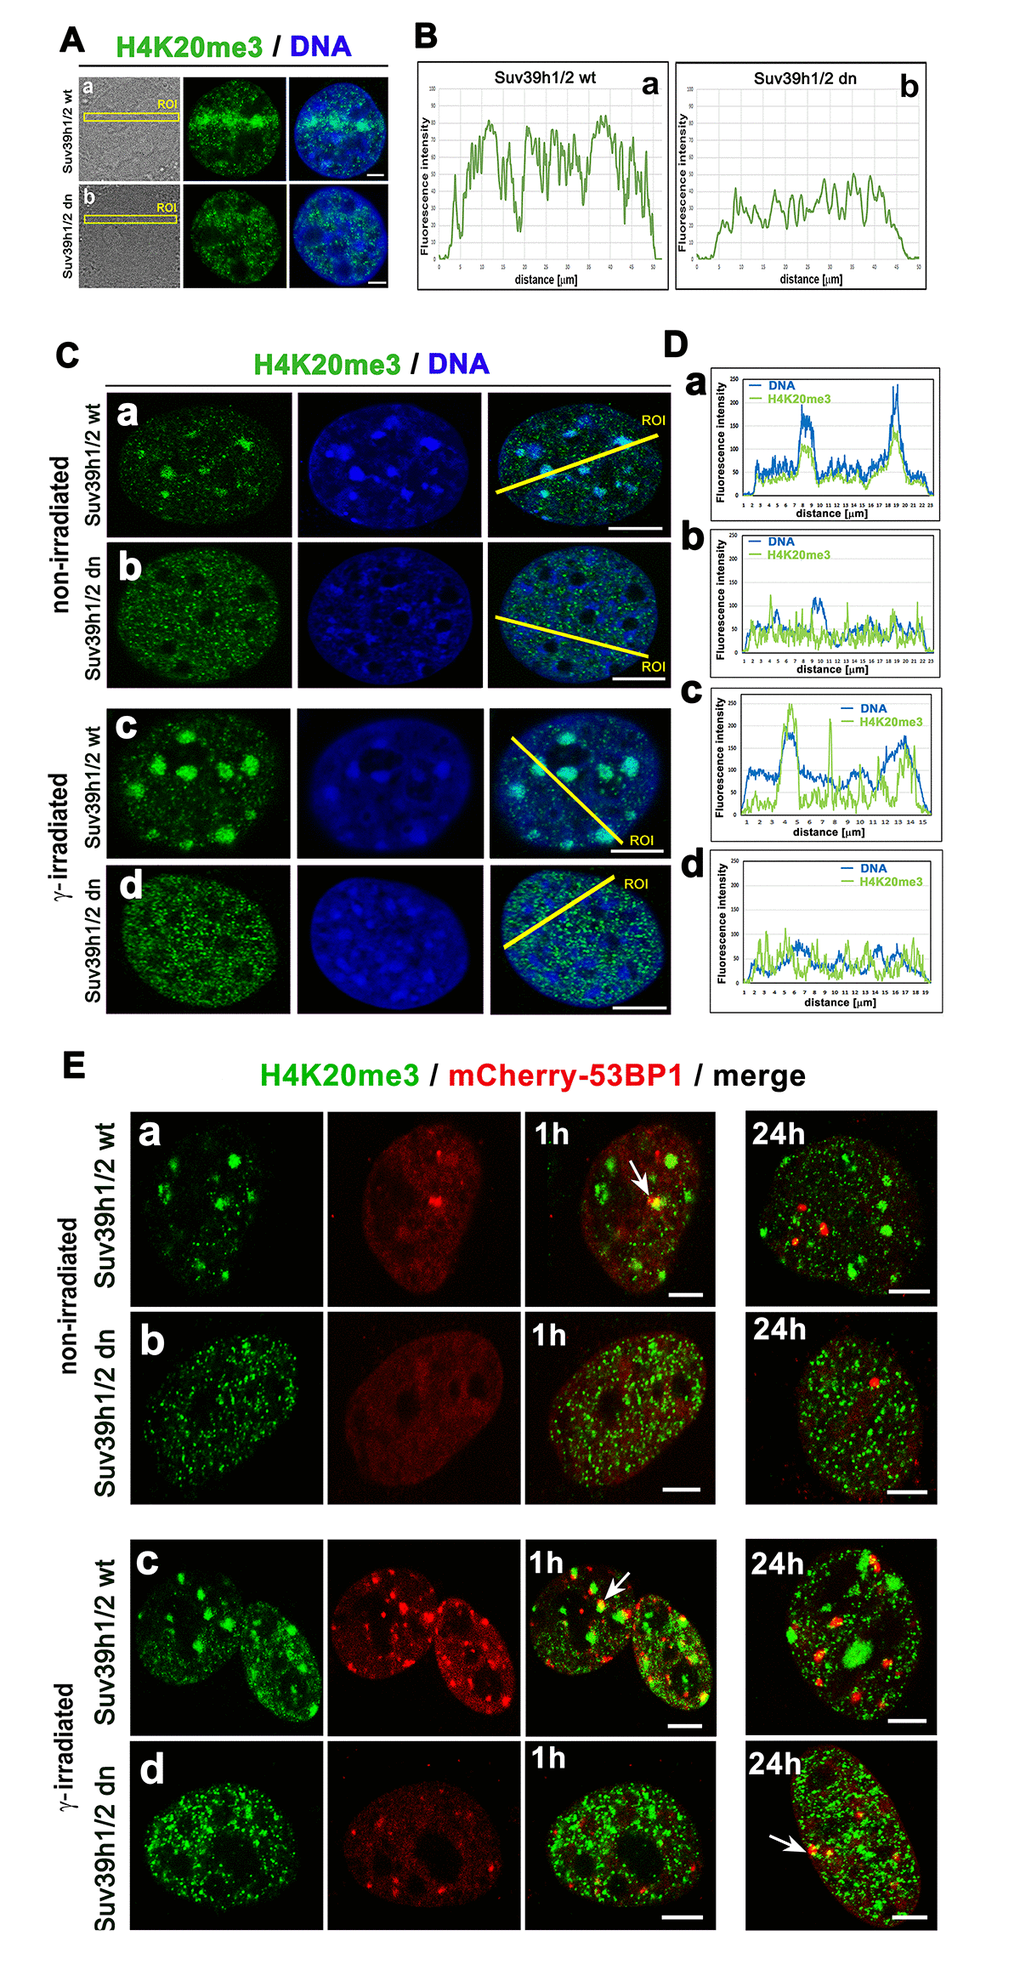
Figure 7.The nuclear distribution pattern of H4K20me3 (green) in UV-damaged chromatin. (Aa) Non-irradiated and γ-irradiated Suv39h1/h2 wt and (Ab) non-irradiated and γ-irradiated Suv39h1/h2 dn MEFs. DAPI (blue) was used as a counterstain. Scale bars represent 10 µm. (B) Quantification of H4K20me3 (green) shown in panels Aa, Ab. Quantification of H4K20me3 was performed according to the selected region of interests (ROIs, yellow lines). LAS AX software was used for analysis of fluorescence intensities. (C) Nuclear distribution pattern of H4K20me3 in (a) non-irradiated and (c) γ-irradiated Suv39h1/h2 wt and (b) non-irradiated and (d) γ-irradiated Suv39h1/h2 dn fibroblasts. (D) Quantification of fluorescence intensity of H4K20me3 is shown in panel Ca-d. Analysis by LAS AF software was performed in (a) non-irradiated and (c) γ-irradiated Suv39h1/h2 wt and (b) non-irradiated and (d) γ-irradiated Suv39h1/h2 dn MEFs. (E) Nuclear distribution of H4K20me3 (green) and the 53BP1 protein (red) in (a) non-irradiated and (c) γ-irradiated Suv39h1/h2 wt and (b) non-irradiated and (d) γ-irradiated Suv39h1/h2 dn cells.