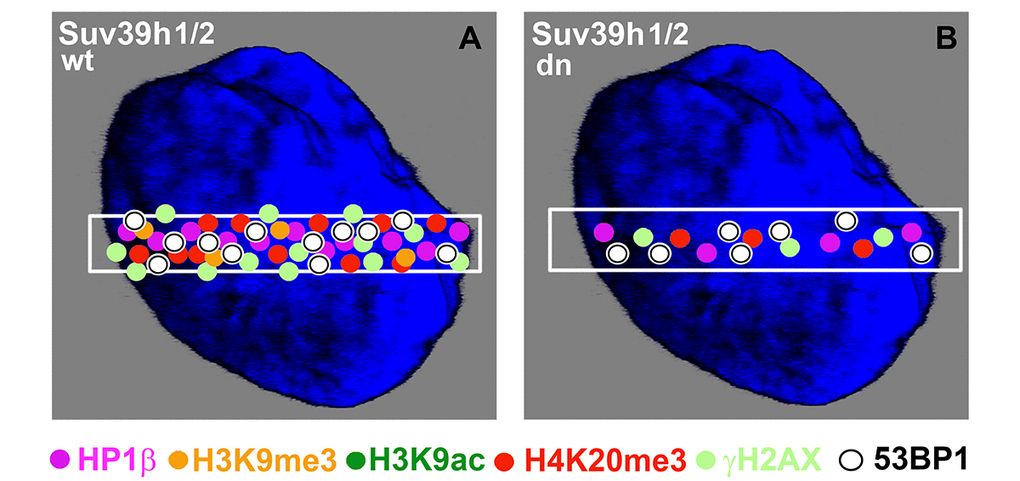
Figure 11.Schematic illustration of protein levels in DNA lesions in wild-type and Suv39h1/h2 dn mouse embryonic fibroblasts. Colored dots illustrate the levels of selected proteins at UVA-irradiated chromatin. The illustration demonstrates the appearance of the following proteins at DNA lesions: HP1β (pink circles), H3K9me3 (orange circles), H3K9ac (dark green circles), H4K20me3 (red circles), γH2AX (pale green circles), and 53BP1 (white circles). The selected micro-irradiated ROI is shown by a white rectangle. The figure represents an illustration of our results.