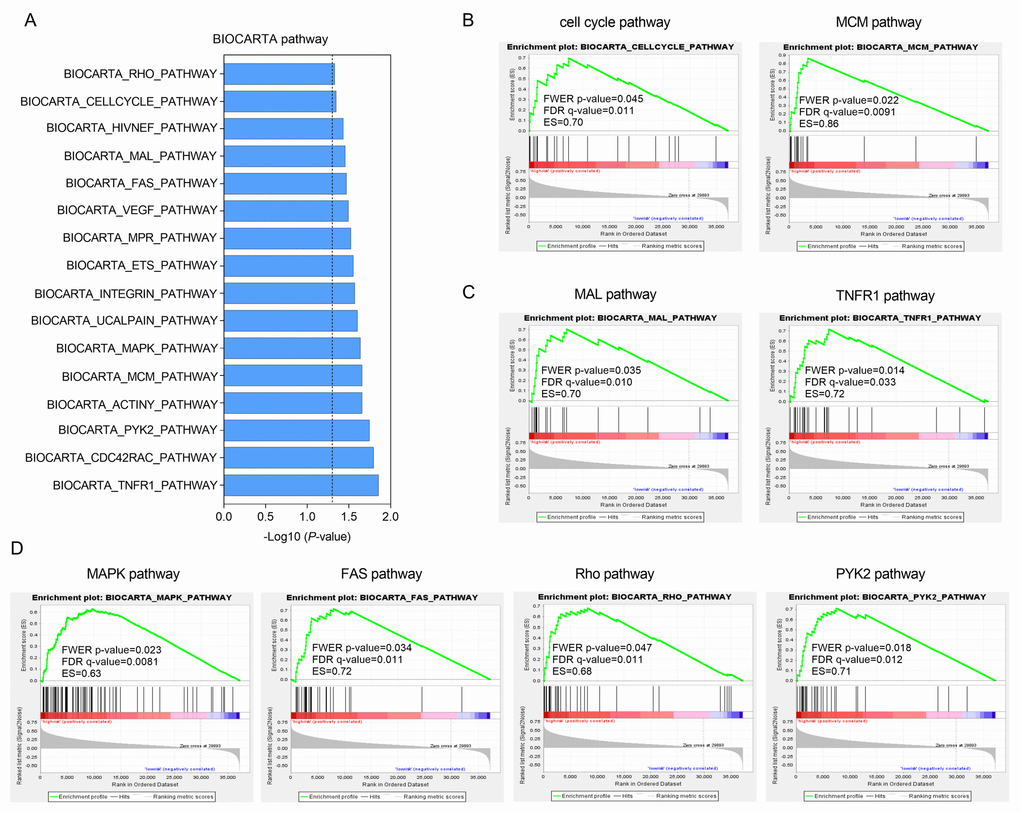
Figure 5.Functional enrichment of HCC-specific gene signature in high-risk patients of TCGA series. (A) The bar chart of 16 significantly enriched BIOCARTA pathways through GSEA. (B, C and D) Significantly enriched pathways associated with cell cycle (B), TNF-κB signaling (C) and MAPK pathway (D).