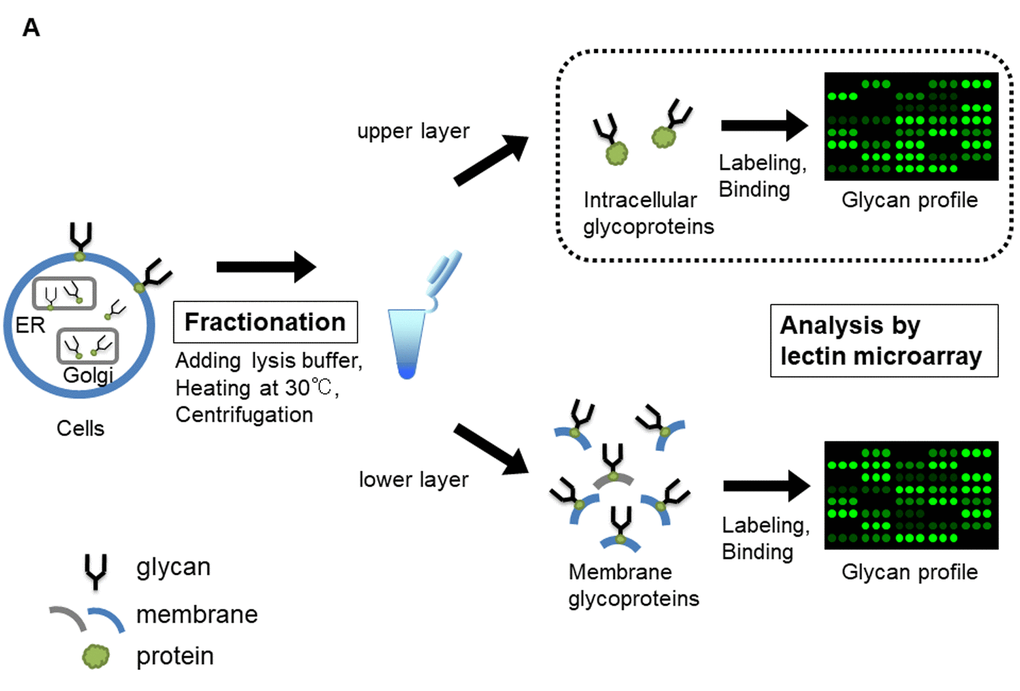
Figure 1A.Lectin microarray analysis for glycoproteins of TIG-3S, TIG-101, and TIG-102 at various PDLs. Schematic illustration of lectin microarray analysis for intracellular glycoproteins (enclosed by dotted line). Collected cells were heated and centrifuged with lysis buffer, containing 0.1% protease inhibitor, followed by fractionating as intracellular glycoproteins (upper layer) and membrane glycoproteins (lower layer).