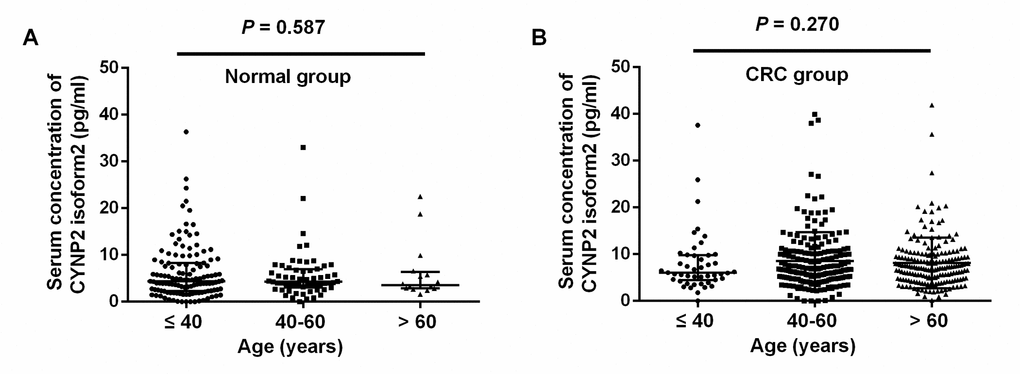
Figure 1.Scatter plots of serum CNPY2 isoform 2 concentrations among different age groups. (A) Comparison of serum CNPY2 isoform 2 levels of different age groups in healthy controls. (B) Comparison of serum CNPY2 isoform 2 levels of different age groups of colorectal cancer (CRC) patients. A Mann–Whiney U test was used to compare the CNPY2 isoform 2 levels among different age groups.