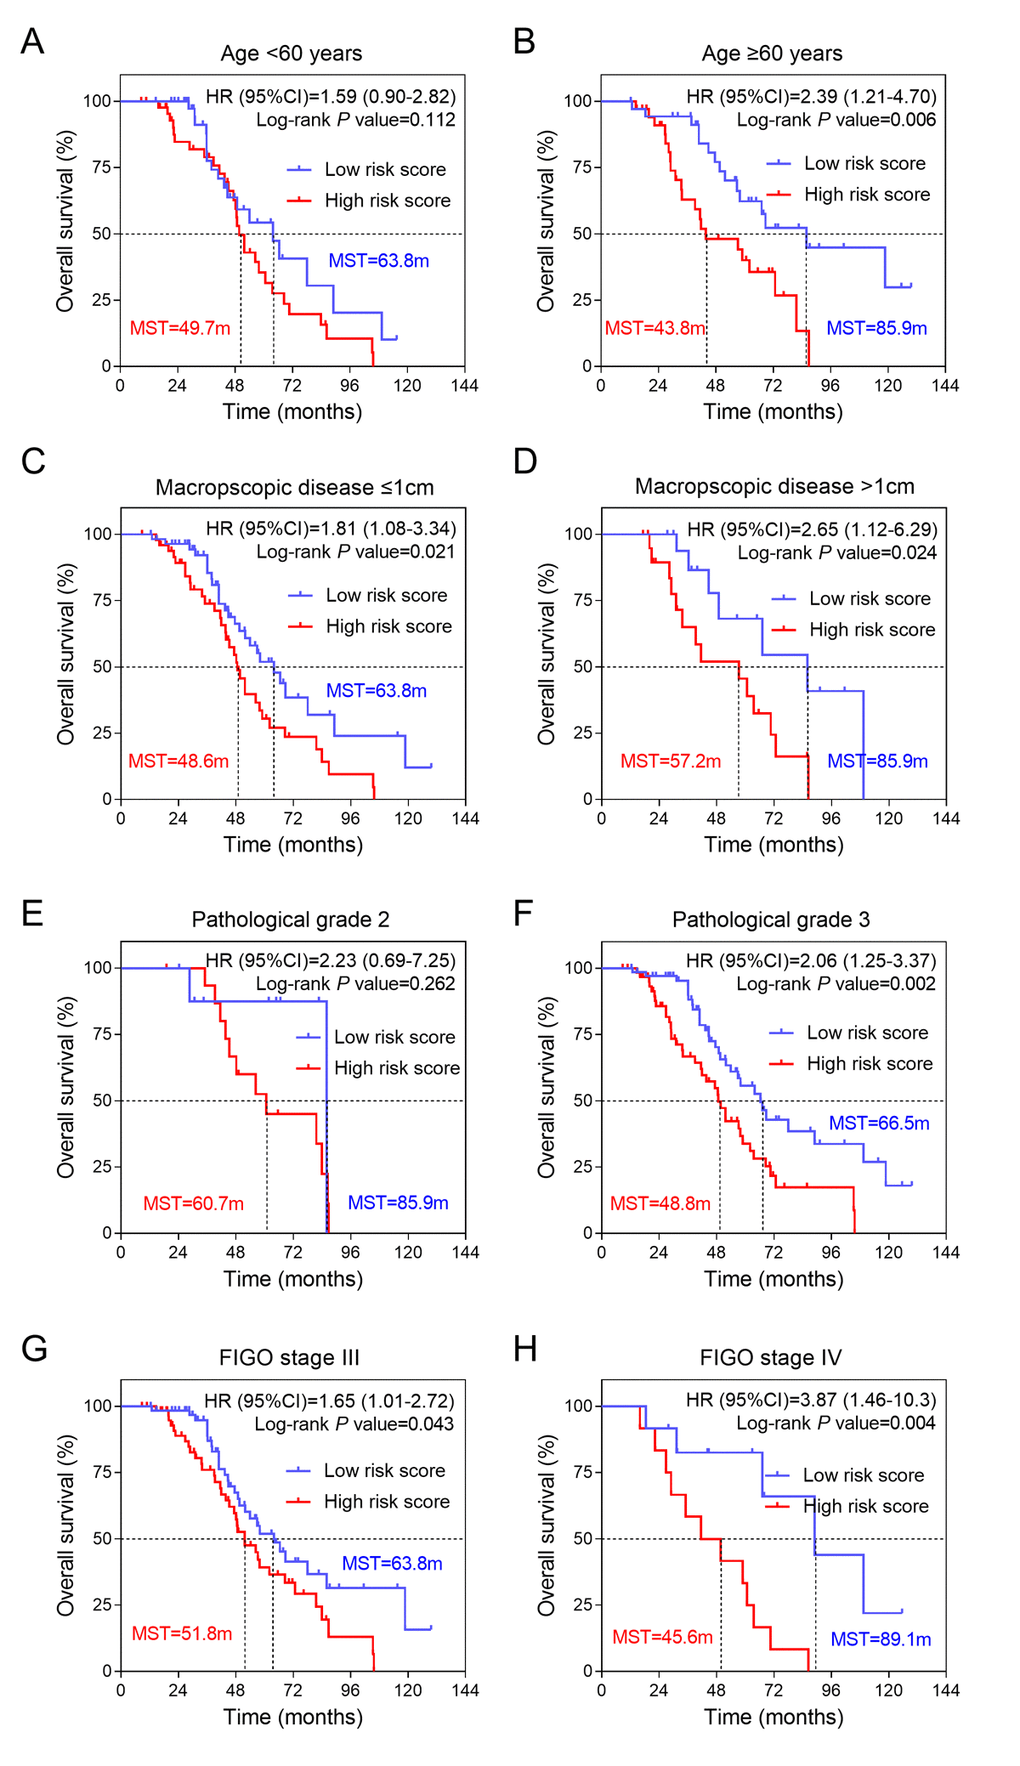
Figure 4.Effects of SAMR1 and SAMP8 mice fecal microbiota transplant on behavior in pseudo germ-free mice. (A) Kaplan-Meier curves for younger patients (age<60 years). (B) Kaplan-Meier curves for older patients (age≥60 years). (C) Kaplan-Meier curves for patients with macroscopic disease ≤1cm. (D) Kaplan-Meier curves for patients with macroscopic disease >1cm. (E) Kaplan-Meier curves for patients with pathological grade 2. (F) Kaplan-Meier curves for patients with pathological grade 3. (G) Kaplan-Meier curves for patients with FIGO stage III. (H) Kaplan-Meier curves for patients with FIGO stage IV. FIGO, International Federation of Gynecology and Obstetrics.