Submit an Article
Navigate
Home
Editorial Board
Editorial Policies
Current Volume
Archive
Scientific Integrity
Publication Ethics Statements
Interviews with Outstanding Authors
Newsroom
Sponsored Conferences
Podcast
Contact
Special Collections
Submit an Article
Online ISSN: 1945-4589
Research Paper
|
Volume 10, Issue 5
|
pp. 1073–1088
XPG
rs17655 G>C polymorphism associated with cancer risk: evidence from 60 studies
Back to article
Figure 3
(3 of 3)
−
100%
+
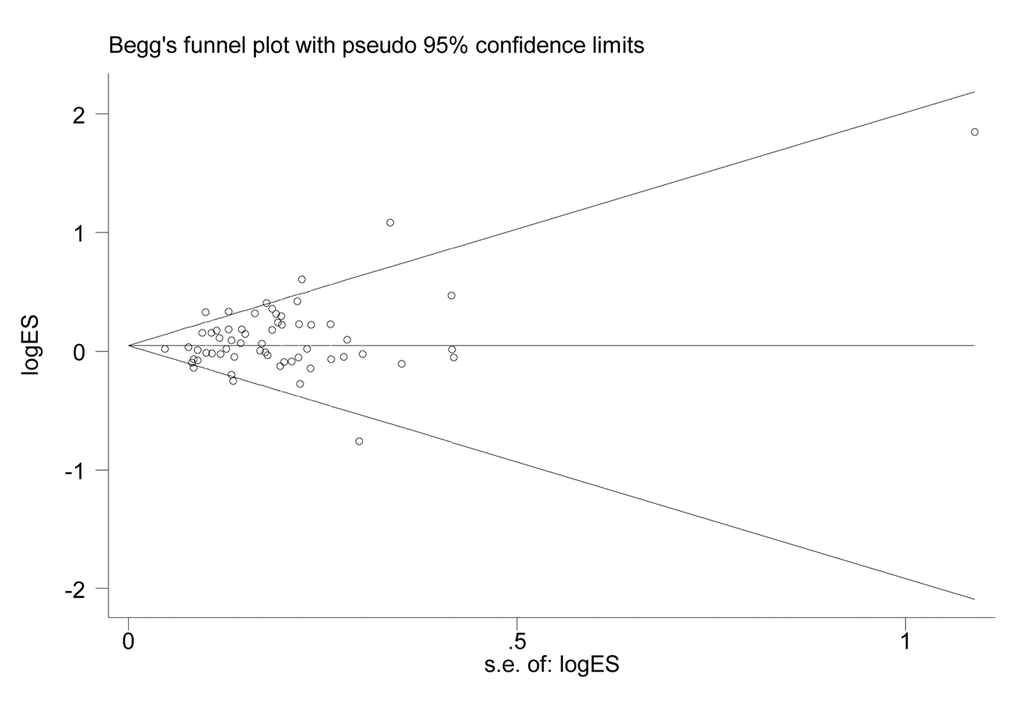
Figure 3.
Funnel plot for the association between
XPG
gene rs17655 G>C polymorphism and overall cancer risk under the dominant model (CG/CC vs. GG).