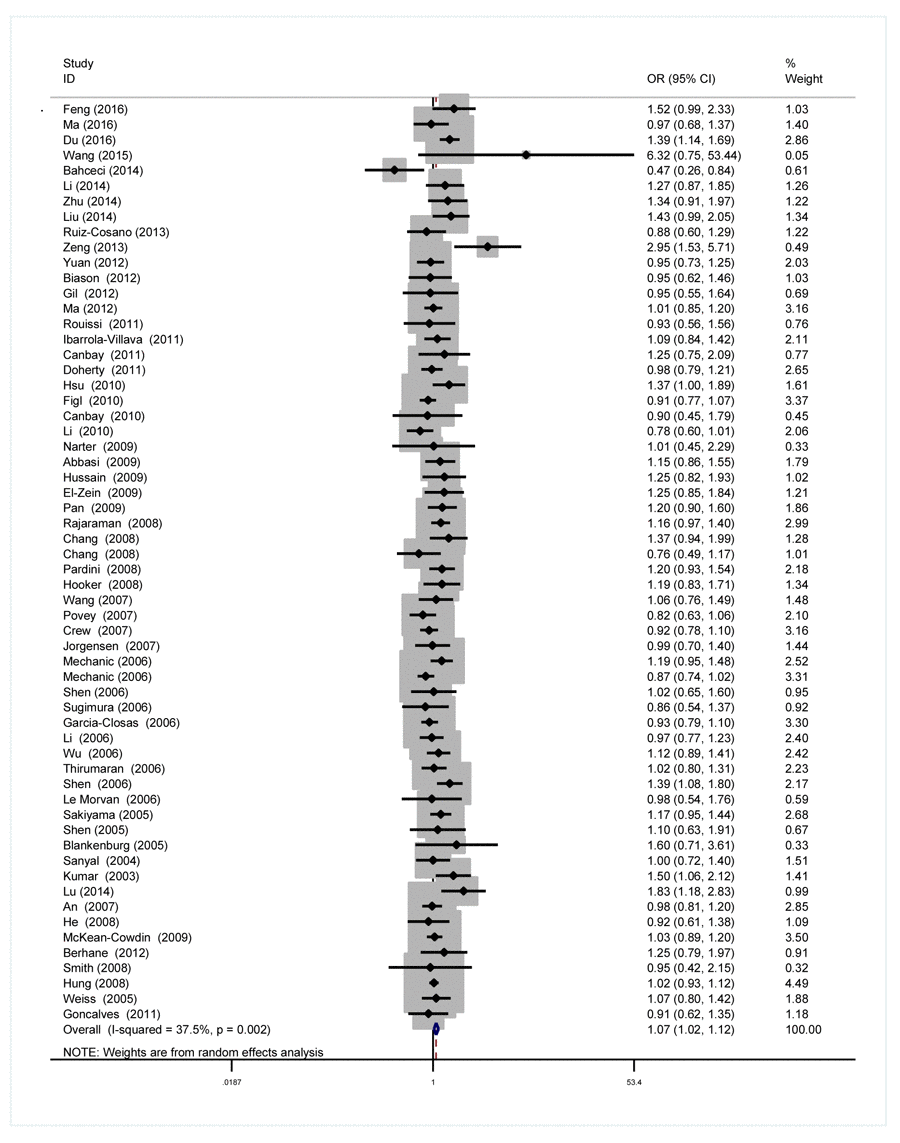
Figure 2.Forest plot for the association between the XPG rs17655 G>C polymorphism and overall cancer risk under the dominant model (CG/CC vs. GG). For each publication, the estimation of OR and its 95% CI was plotted with a box and a horizontal line. The diamonds represented the pooled ORs and 95% CIs.