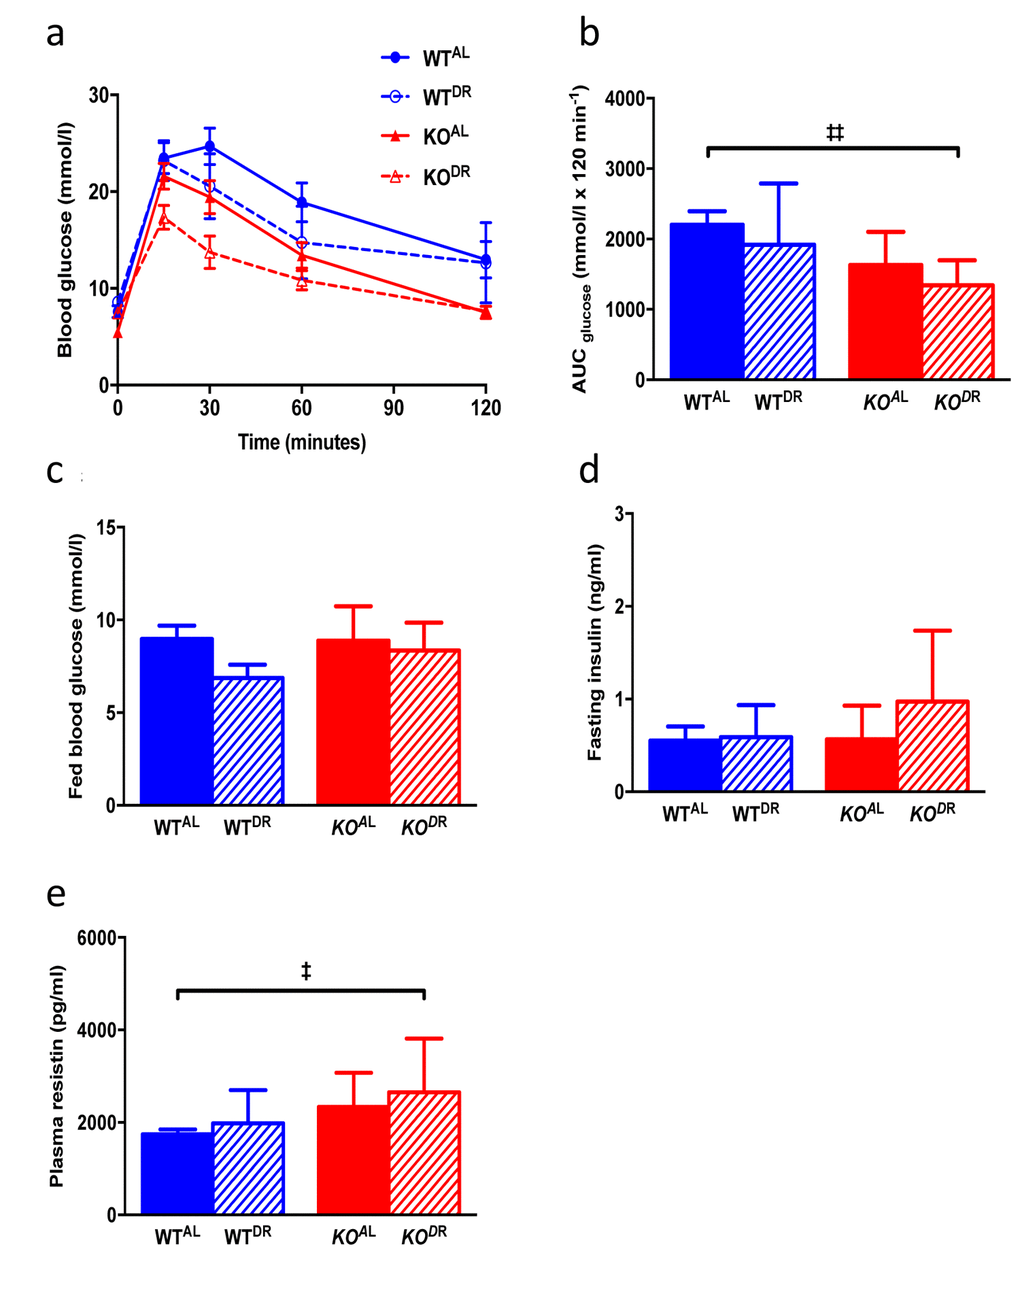
Figure 8.Glucose and insulin metabolism in 15-month-old WT and KO mice. (a) Glucose tolerance curves (b) area under the curve (c) fed blood glucose (d) fasting circulating insulin levels. (e) Plasma resistin levels. WTAL, n = 8; WTDR, n = 6; KOAL, n = 14; KODR, n = 10. Error bars represent mean ± SEM. * represents significant effect of treatment and ‡ represents significant effect of genotype. ‡ p < 0.05; **/‡‡ p < 0.01.