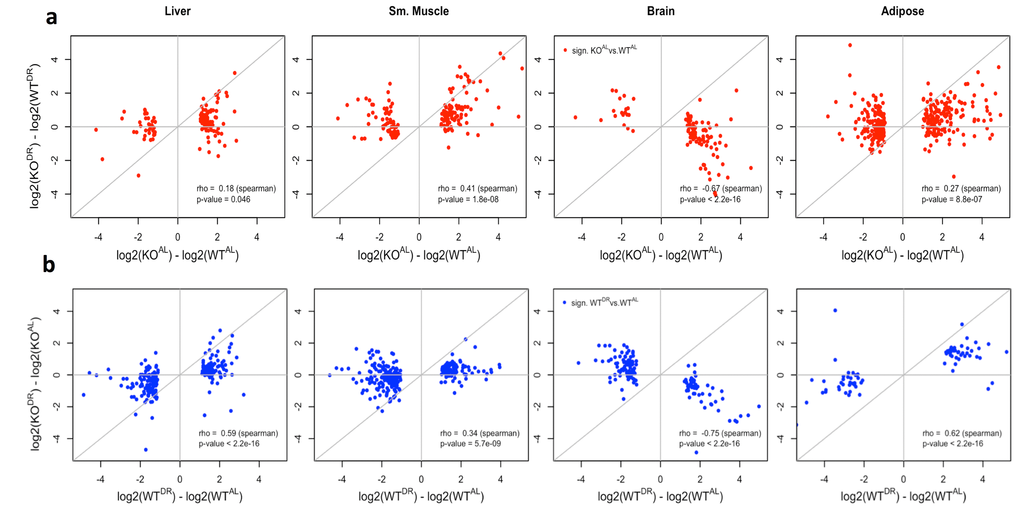
Figure 6.Correlation of WT and KO fed AL or DR diets. (a) The log2 fold change correlation between WT and KO fed AL or DR conditions of genes significantly differentially expressed (q value < 0.10) when comparing WT and KO expression in AL conditions (red). (b) The log2 fold change between AL or DR conditions in WT and KO backgrounds of genes significantly differentially expressed (q value < 0.10) when comparing AL and DR conditions in a WT background (blue).