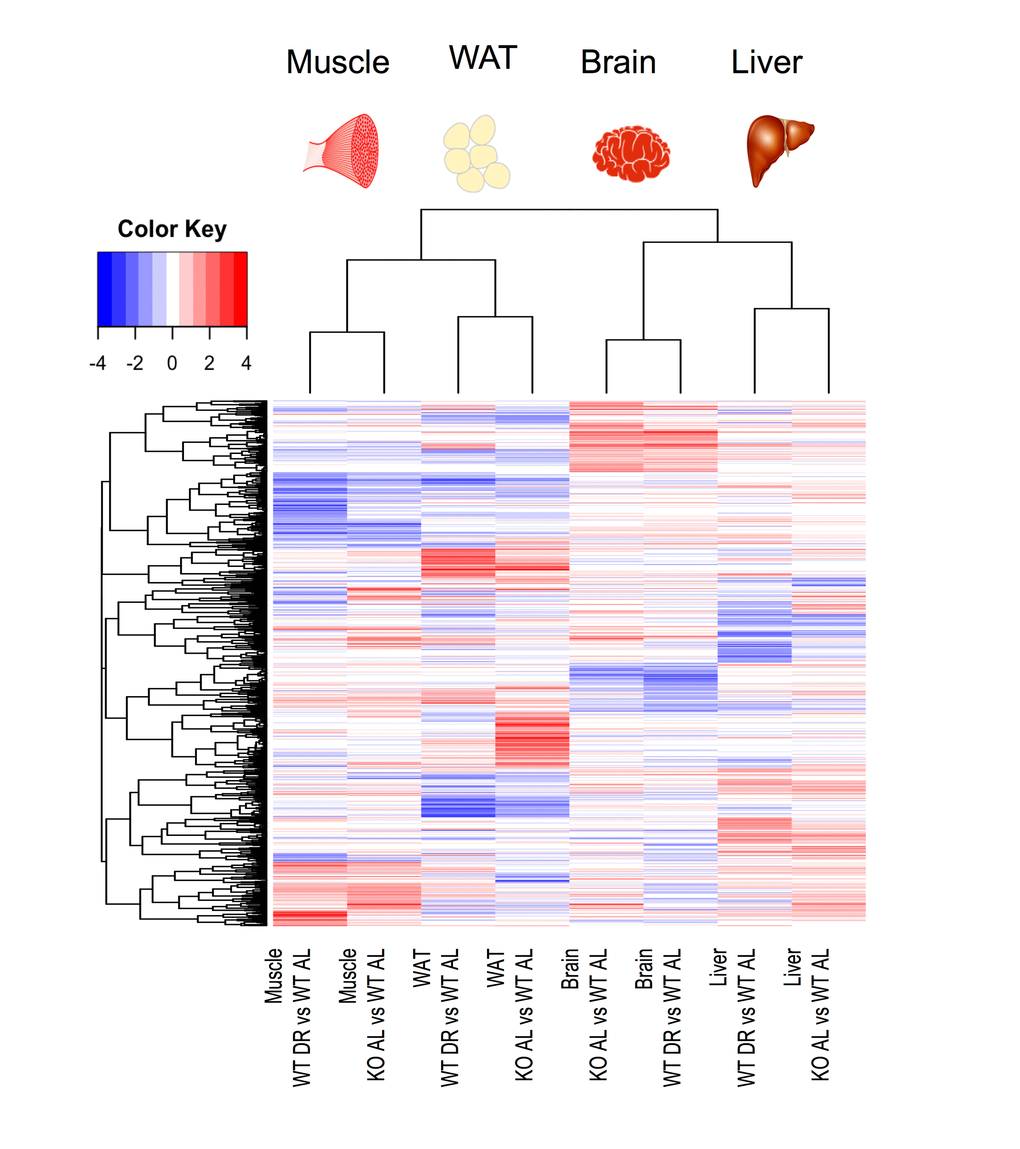
Figure 3.Heat map of significantly differentially expressed genes in liver, skeletal muscle, brain and WAT from either KOAL or WTDR mice compared to WTAL. A total of 1172 genes were significantly differentially expressed. Red represents up-regulated genes and blue represents down-regulated genes.