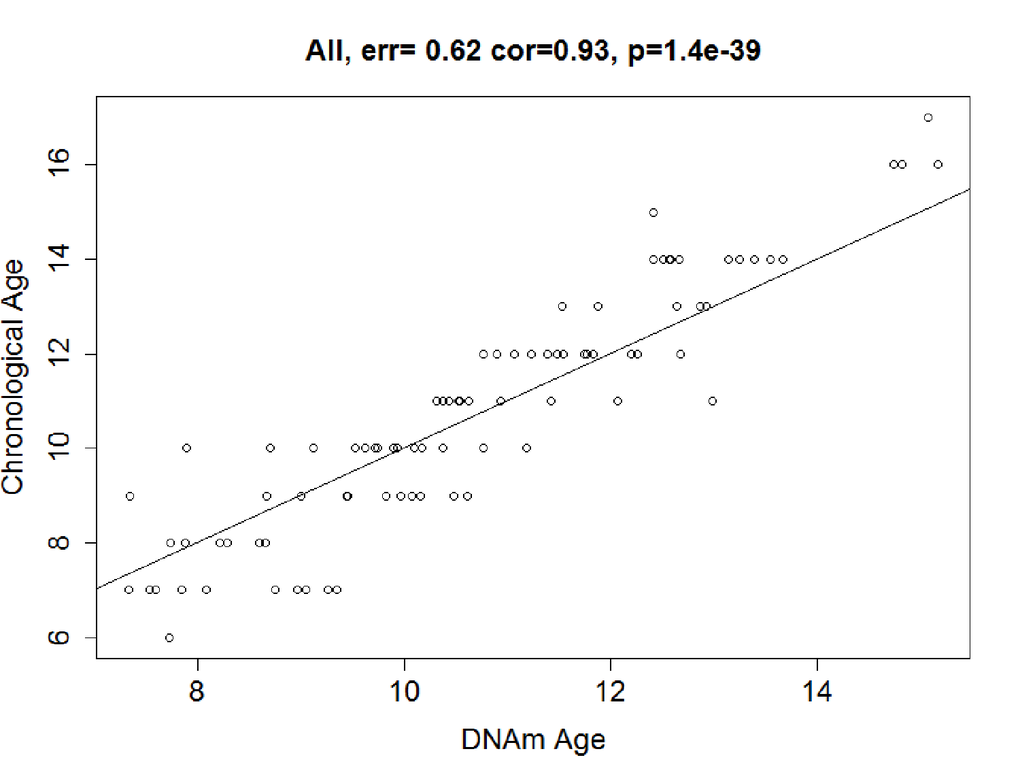
Figure 2b.Correlation between Chronological age and DNAm age. DNAm age were also highly correlated with chronological age in the testing dataset: r = 0.93, median error = 0.64 years. Solid line = regression line.
Figure 2b — Age prediction of children and adolescents aged 6-17 years: an epigenome-wide analysis of DNA methylation | Aging