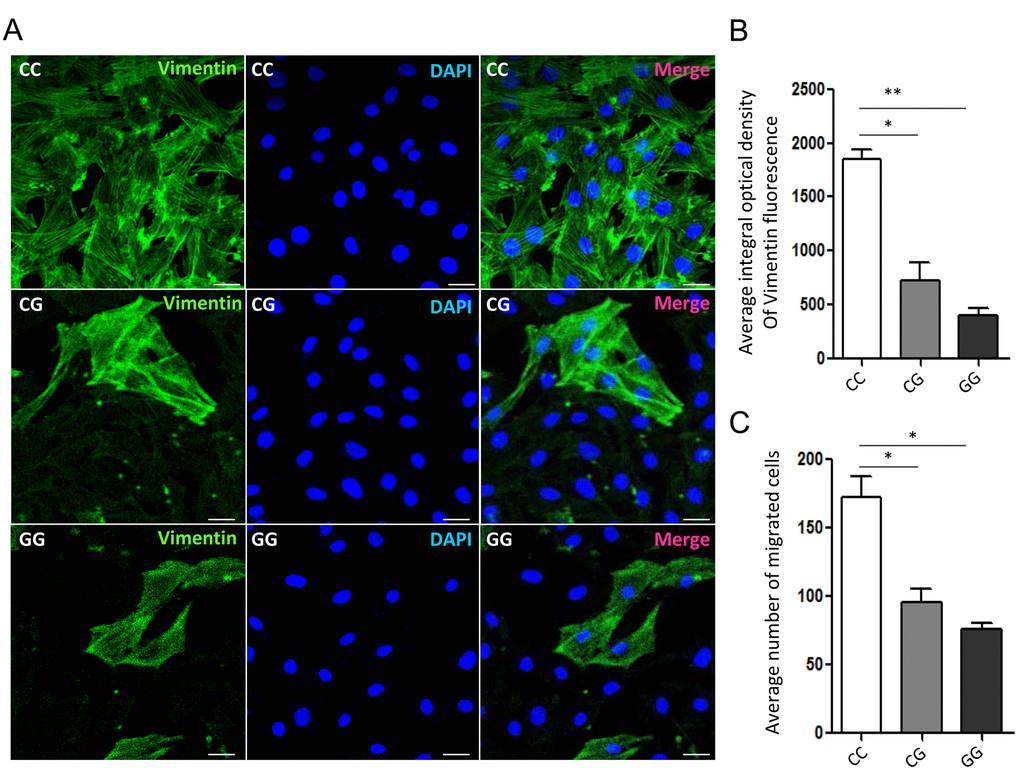
Figure 5.Vimentin organization and migration of GBM primary cells with different genotypes of rs11558961. (A) Representative confocal-microscopy graphs of immunostaining for Vimentin in rs11558961 CC, CG and GG cells. Green: Vimentin; Blue: DAPI. (B) Quantitative analysis of vimentin fluorescence in different groups. (C) Migration of cells with different genotypes. The experiment was repeated three times. Data were presented as mean ± SD. Scale bar = 50μm. *P<0.05, **P<0.01.