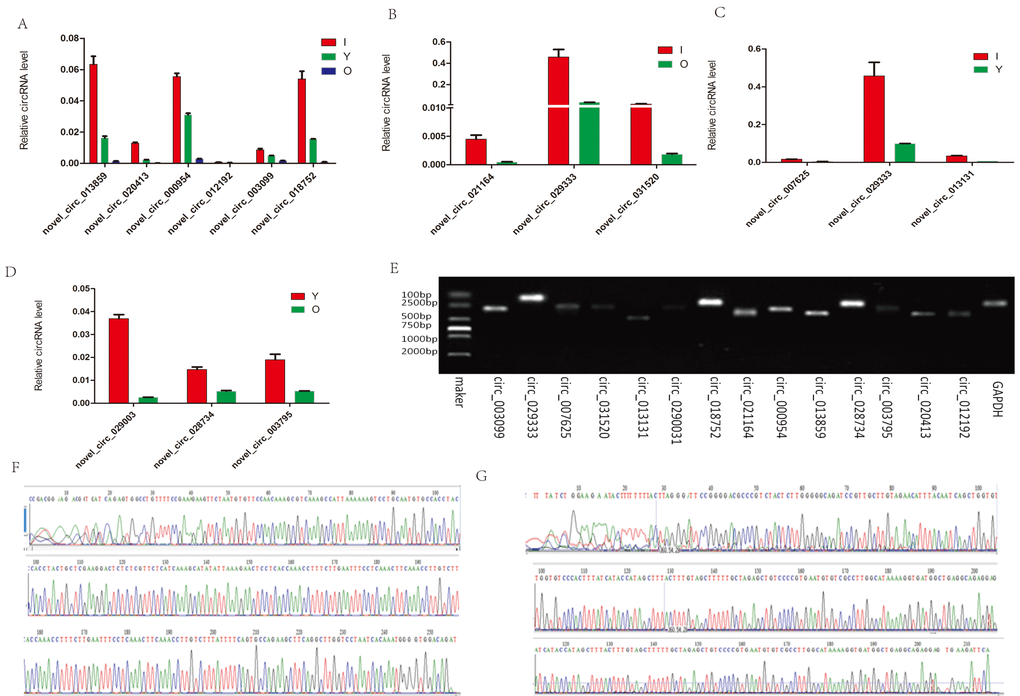
Figure 7.RT-PCR and Sanger sequencing validation of the selected circRNAs. (A) Six circRNAs from the cerebellum were quantified by RT-qPCR analysis. (B–D) Expression level changes for eight circRNAs from the hippocampus using RT-qPCR between I vs O, I vs Y, and Y vs O. (E) RT-qPCR products were visualized using electrophoresis. (F–G) Two representative examples of qPCR products confirmed by Sanger sequencing. F: novel_circ_013859. G: novel_circ_007625.