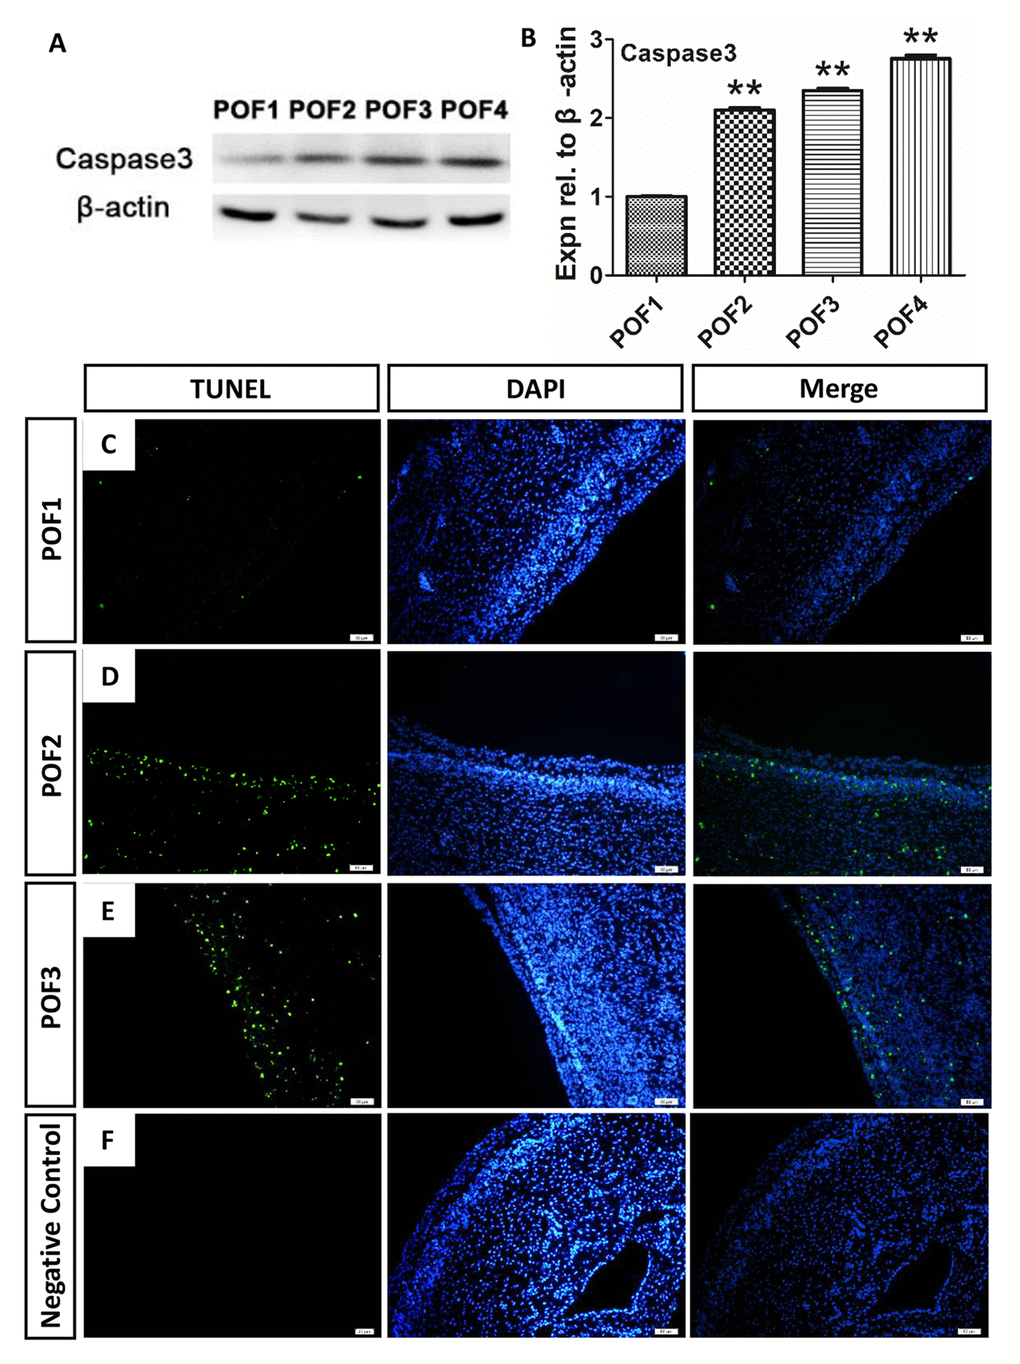
Figure 4.Caspase-induced apoptosis leads to POF degradation. (A-B) WB and grey analysis of caspase3 expression in POFs (POF1 to POF4). Values are means ± SEM of three experiments. Asterisks indicate significant differences (* P<0.05 and ** P<0.01). (B-E) Few TUNEL (green) marker labeled occurred in cells from POF1 to POF3. (D) Negative Control. Scale bar: 50 µm.