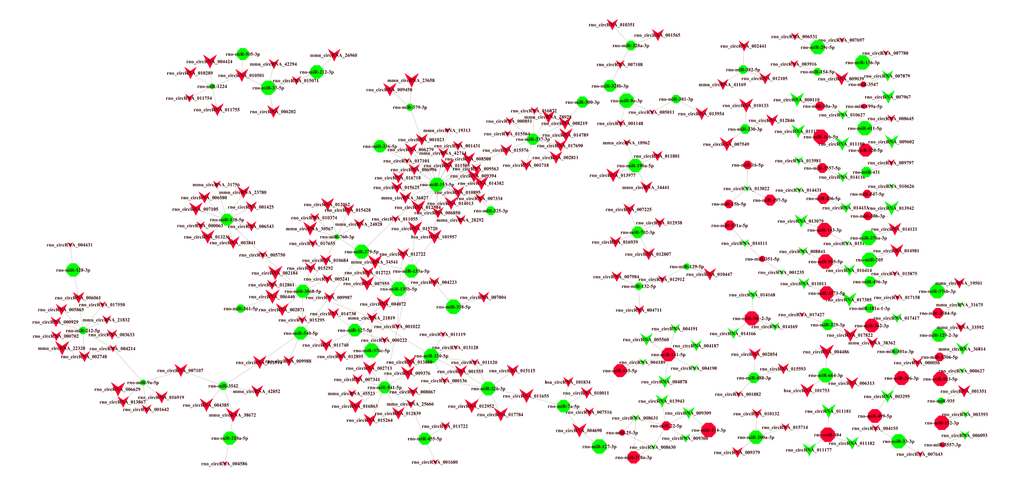
Figure 6.CircRNA-miRNA network analysis. A total of 245 circRNAs and 144 miRNAs containing 279 relationships were selected to generate a network map. The circRNA-miRNA co-expression network was constructed with Cytoscape V3.5.0 software. Within this network, V-shaped nodes represent circRNA and octagon nodes represent miRNA. Red and green represent up- and down-regulation, respectively. Node size represents p-values (larger nodes for more significant p-values).