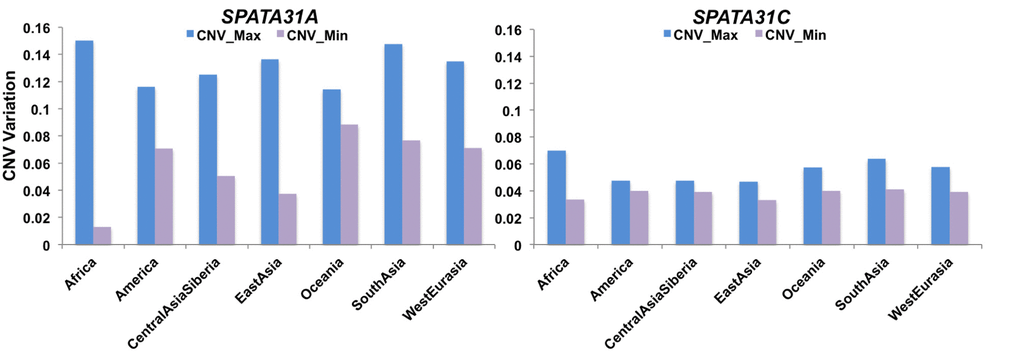
Figure 2.Range of SPATA31 copy numbers in different human population groups. The data are based on normalized read depth from the Simons Genome Project data [26] from which we have also retrieved the classification into population groups. The Y-axis represents normalized read depth measures, minimum and maximum values are provided for each group.