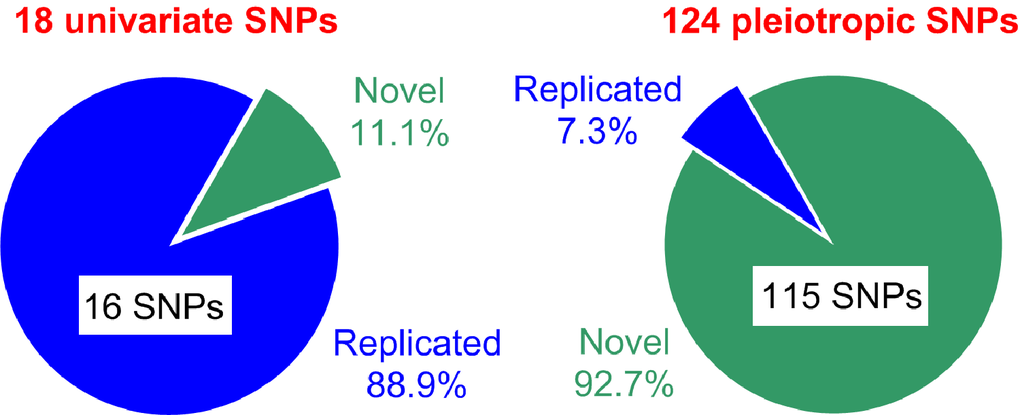
Figure 5.Summary of SNPs identified in the univariate and pleiotropic meta-analyses. Green and blue colors denote novel and replicated SNPs, respectively.
Figure 5 — Strong impact of natural-selection–free heterogeneity in genetics of age-related phenotypes | Aging