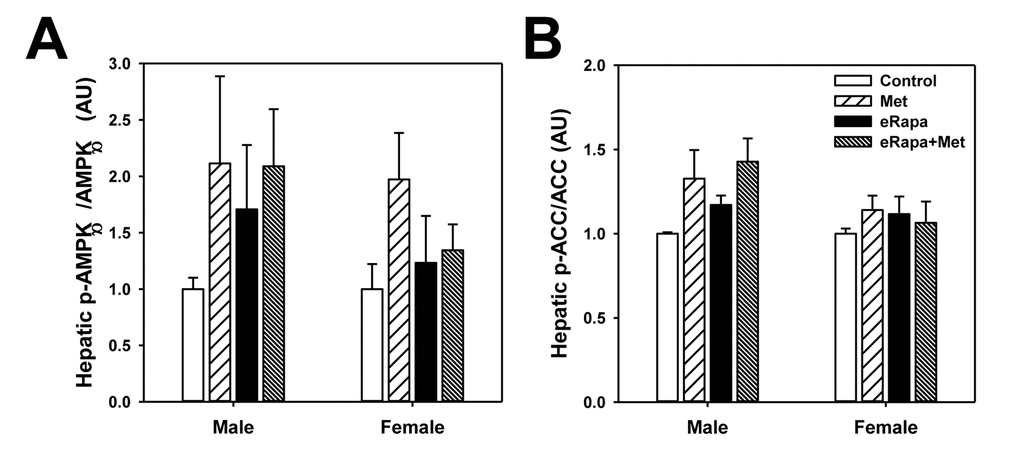
Figure 6.Mild activation of AMPK signaling in metformin treated mice. Quantification of phosphorylation/total protein ratios for (A) AMPKα and (B) ACC from liver of male and female mice fed indicated diets. Bars represent mean values for diet/sex ± SEM. For all groups, n=6.