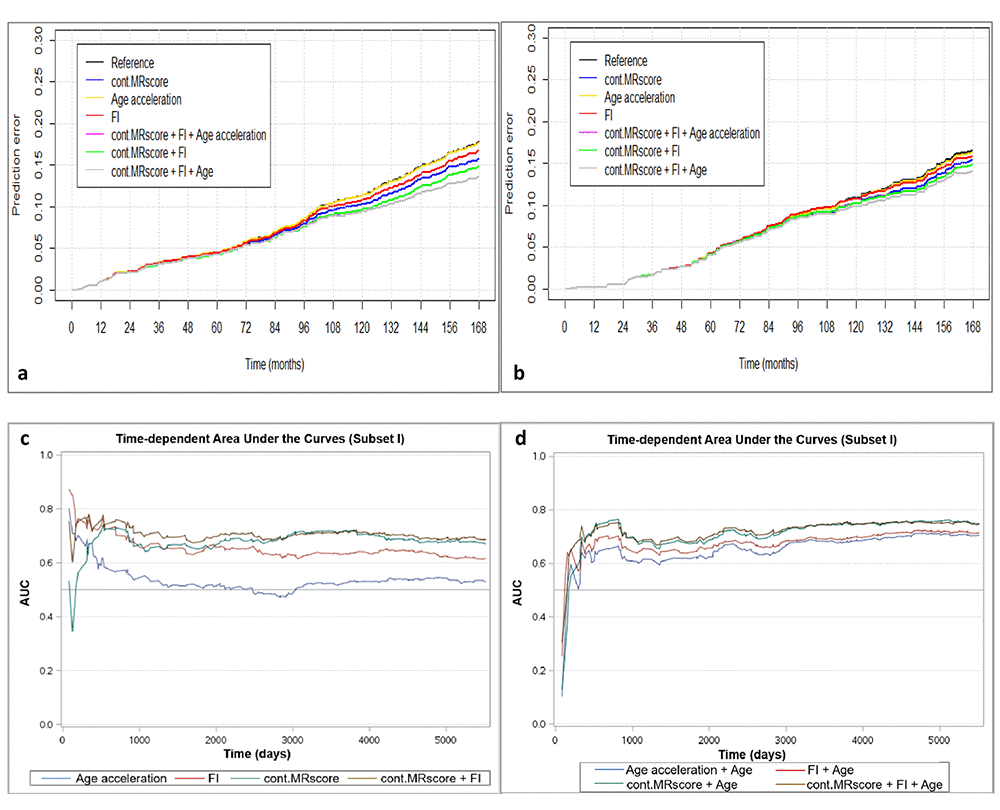
Figure 2a-d.Predictive performance of methylomic survival predictors and frailty index. (a) predictive prediction error curves in subset I; (b) predictive prediction error curves in subcohort of subset II; (c) Time-dependent area under the curves (AUCs) of methylomic survival predictors and frailty index in subset I; (d) Time-dependent AUCs of combination of age with methylomic survival predictors and frailty index in subset I.