Submit an Article
Navigate
Home
Editorial Board
Editorial Policies
Current Volume
Archive
Scientific Integrity
Publication Ethics Statements
Interviews with Outstanding Authors
Newsroom
Sponsored Conferences
Podcast
Contact
Special Collections
Submit an Article
Online ISSN: 1945-4589
Research Paper
|
Volume 10, Issue 2
|
pp. 266–277
Four common polymorphisms of BRIP1 (rs2048718, rs4988344, rs4986764, and rs6504074) and cancer risk: evidence from 13,716 cancer patients and 15,590 cancer-free controls
Back to article
Figure 2
(2 of 5)
−
100%
+
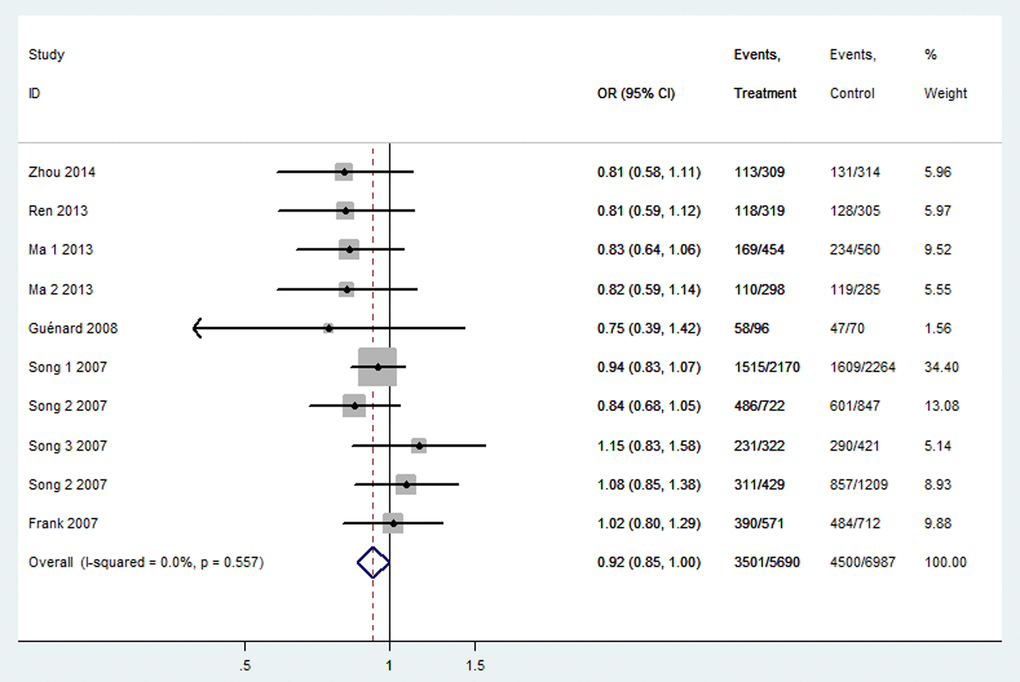
Figure 2.
Forest plot of OR with 95%CI for the BRIP1 polymorphisms with cancer risk under dominant model rs2048718.
CI: confidence interval, OR: odds ratio.