Submit an Article
Navigate
Home
Editorial Board
Editorial Policies
Current Volume
Archive
Scientific Integrity
Publication Ethics Statements
Interviews with Outstanding Authors
Newsroom
Sponsored Conferences
Podcast
Contact
Special Collections
Submit an Article
Online ISSN: 1945-4589
Research Paper
|
Volume 10, Issue 2
|
pp. 178–196
Genes associated with Type 2 Diabetes and vascular complications
Back to article
Figure 1
−
100%
+
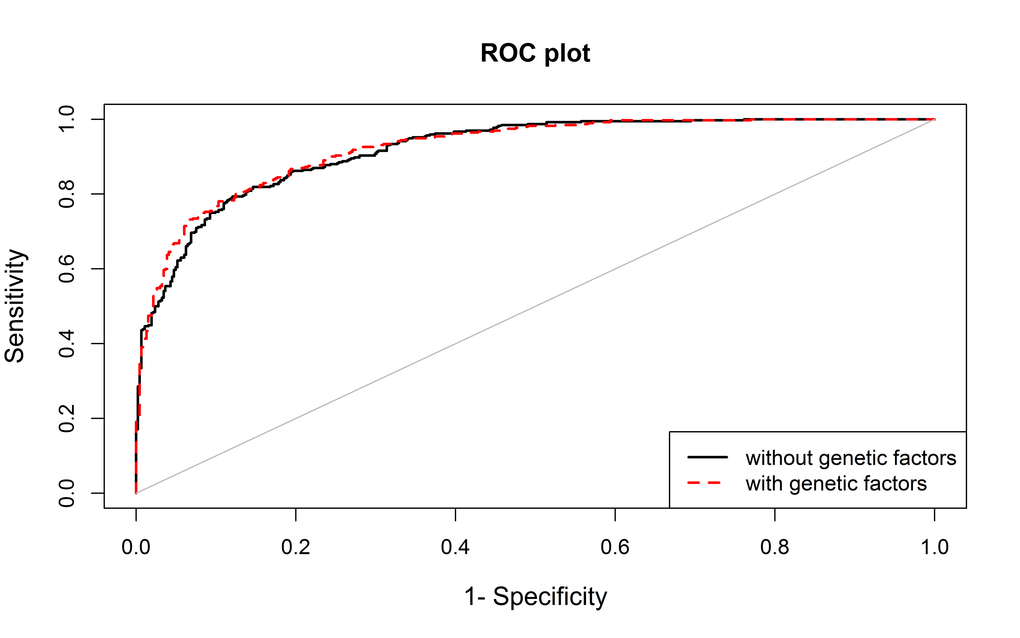
Figure 1.
The area under the curve (AUC) for the model including non-genetic variables (age, sex, BMI and family history, in black) and for the model also including genetic data (rs4402960 and rs2736098, in red).