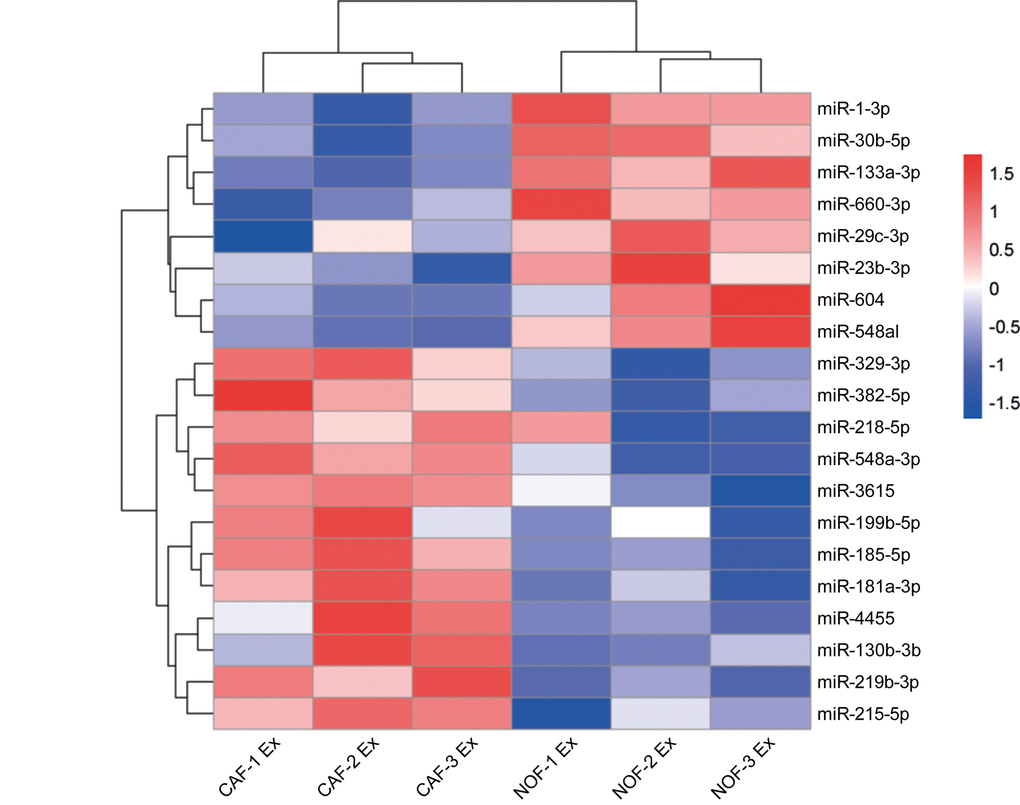
Figure 5.Differential expression of miRNAs in NOF and CAF exosomes. Hierarchical cluster analysis of miRNAs in NOF and CAF exosomes. The top 20 most changing miRNAs are shown. Blue-red color scale corresponds with fold changes between -1.5 and +1.5. NOF Ex, normal fibroblast exosome; CAF Ex, cancer-associated fibroblast exosome.